
|
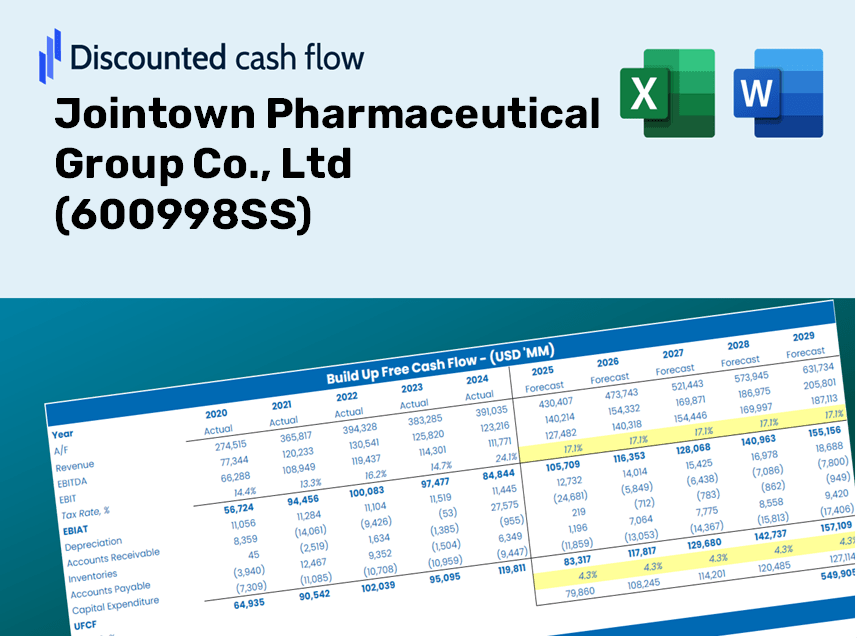
Jointown Pharmaceutical Group Co., Ltd (600998.SS) DCF Valuation |
Fully Editable: Tailor To Your Needs In Excel Or Sheets
Professional Design: Trusted, Industry-Standard Templates
Investor-Approved Valuation Models
MAC/PC Compatible, Fully Unlocked
No Expertise Is Needed; Easy To Follow
Jointown Pharmaceutical Group Co., Ltd (600998.SS) Bundle
Discover the true potential of Jointown Pharmaceutical Group Co., Ltd (600998SS) with our advanced DCF Calculator! Adjust key variables, explore various scenarios, and assess how modifications influence the valuation of Jointown Pharmaceutical Group Co., Ltd (600998SS) – all within one convenient Excel template.
Discounted Cash Flow (DCF) - (USD MM)
| Year | AY1 2020 |
AY2 2021 |
AY3 2022 |
AY4 2023 |
AY5 2024 |
FY1 2025 |
FY2 2026 |
FY3 2027 |
FY4 2028 |
FY5 2029 |
|---|---|---|---|---|---|---|---|---|---|---|
| Revenue | 110,859.5 | 122,407.4 | 140,424.2 | 150,139.8 | 151,809.8 | 161,141.9 | 171,047.6 | 181,562.3 | 192,723.3 | 204,570.4 |
| Revenue Growth, % | 0 | 10.42 | 14.72 | 6.92 | 1.11 | 6.15 | 6.15 | 6.15 | 6.15 | 6.15 |
| EBITDA | 4,238.6 | 3,634.5 | 4,416.0 | 4,729.9 | 4,612.3 | 5,197.1 | 5,516.6 | 5,855.7 | 6,215.7 | 6,597.8 |
| EBITDA, % | 3.82 | 2.97 | 3.14 | 3.15 | 3.04 | 3.23 | 3.23 | 3.23 | 3.23 | 3.23 |
| Depreciation | 514.3 | 547.2 | 626.4 | 677.0 | 689.7 | 729.1 | 773.9 | 821.5 | 872.0 | 925.6 |
| Depreciation, % | 0.46395 | 0.44704 | 0.44608 | 0.45089 | 0.45431 | 0.45245 | 0.45245 | 0.45245 | 0.45245 | 0.45245 |
| EBIT | 3,724.2 | 3,087.3 | 3,789.6 | 4,053.0 | 3,922.6 | 4,468.0 | 4,742.7 | 5,034.2 | 5,343.7 | 5,672.2 |
| EBIT, % | 3.36 | 2.52 | 2.7 | 2.7 | 2.58 | 2.77 | 2.77 | 2.77 | 2.77 | 2.77 |
| Total Cash | 14,824.6 | 18,298.7 | 17,495.7 | 17,039.2 | 18,362.4 | 20,698.7 | 21,971.1 | 23,321.7 | 24,755.4 | 26,277.1 |
| Total Cash, percent | .0 | .0 | .0 | .0 | .0 | .0 | .0 | .0 | .0 | .0 |
| Account Receivables | 32,507.6 | 32,739.3 | 30,511.2 | 34,071.7 | 37,372.7 | 40,320.5 | 42,799.1 | 45,430.0 | 48,222.7 | 51,187.1 |
| Account Receivables, % | 29.32 | 26.75 | 21.73 | 22.69 | 24.62 | 25.02 | 25.02 | 25.02 | 25.02 | 25.02 |
| Inventories | 14,775.2 | 15,516.8 | 17,213.1 | 20,114.0 | 22,851.2 | 21,500.0 | 22,821.7 | 24,224.6 | 25,713.7 | 27,294.4 |
| Inventories, % | 13.33 | 12.68 | 12.26 | 13.4 | 15.05 | 13.34 | 13.34 | 13.34 | 13.34 | 13.34 |
| Accounts Payable | 26,741.3 | 34,158.1 | 33,840.6 | 40,101.2 | 46,510.2 | 43,015.9 | 45,660.2 | 48,467.1 | 51,446.4 | 54,608.9 |
| Accounts Payable, % | 24.12 | 27.91 | 24.1 | 26.71 | 30.64 | 26.69 | 26.69 | 26.69 | 26.69 | 26.69 |
| Capital Expenditure | -1,457.1 | -1,386.3 | -1,243.5 | -1,048.8 | -975.4 | -1,506.2 | -1,598.8 | -1,697.0 | -1,801.4 | -1,912.1 |
| Capital Expenditure, % | -1.31 | -1.13 | -0.88551 | -0.69856 | -0.64253 | -0.93469 | -0.93469 | -0.93469 | -0.93469 | -0.93469 |
| Tax Rate, % | 31.07 | 31.07 | 31.07 | 31.07 | 31.07 | 31.07 | 31.07 | 31.07 | 31.07 | 31.07 |
| EBITAT | 2,642.4 | 2,247.4 | 2,784.0 | 2,946.1 | 2,703.9 | 3,206.5 | 3,403.7 | 3,612.9 | 3,835.0 | 4,070.7 |
| Depreciation | ||||||||||
| Changes in Account Receivables | ||||||||||
| Changes in Inventories | ||||||||||
| Changes in Accounts Payable | ||||||||||
| Capital Expenditure | ||||||||||
| UFCF | -18,841.9 | 7,851.9 | 2,381.2 | 2,373.4 | 2,789.0 | -2,661.4 | 1,422.9 | 1,510.3 | 1,603.2 | 1,701.7 |
| WACC, % | 7.62 | 7.69 | 7.71 | 7.69 | 7.55 | 7.65 | 7.65 | 7.65 | 7.65 | 7.65 |
| PV UFCF | ||||||||||
| SUM PV UFCF | 2,336.8 | |||||||||
| Long Term Growth Rate, % | 3.00 | |||||||||
| Free cash flow (T + 1) | 1,753 | |||||||||
| Terminal Value | 37,675 | |||||||||
| Present Terminal Value | 26,058 | |||||||||
| Enterprise Value | 28,395 | |||||||||
| Net Debt | -5,737 | |||||||||
| Equity Value | 34,132 | |||||||||
| Diluted Shares Outstanding, MM | 5,015 | |||||||||
| Equity Value Per Share | 6.81 |
What You Will Receive
- Comprehensive Financial Model: Jointown Pharmaceutical Group's actual data facilitates accurate DCF valuation.
- Complete Forecasting Control: Modify growth rates, profit margins, WACC, and other critical metrics.
- Real-Time Calculations: Automatic updates provide immediate results as you make adjustments.
- Professional-Grade Template: An expertly crafted Excel file geared towards reliable valuation.
- Flexible and Reusable: Designed for adaptability, enabling repeated use for in-depth forecasts.
Key Features
- Pre-Loaded Data: Jointown Pharmaceutical Group Co., Ltd's historical financial statements and pre-filled forecasts.
- Fully Adjustable Inputs: Modify WACC, tax rates, revenue growth, and EBITDA margins as needed.
- Instant Results: Watch the intrinsic value of Jointown Pharmaceutical Group Co., Ltd (600998SS) update in real time.
- Clear Visual Outputs: Dashboard charts illustrate valuation results and essential metrics.
- Built for Accuracy: A professional-grade tool tailored for analysts, investors, and finance professionals.
How It Works
- Download: Get the comprehensive Excel file featuring Jointown Pharmaceutical Group Co., Ltd’s financial data.
- Customize: Tailor your forecasts, adjusting elements like revenue growth, EBITDA %, and WACC.
- Update Automatically: Watch as the intrinsic value and NPV calculations refresh in real-time.
- Test Scenarios: Generate various projections and quickly compare results.
- Make Decisions: Leverage the valuation insights to shape your investment approach.
Why Choose This Calculator for Jointown Pharmaceutical Group (600998SS)?
- User-Friendly Interface: Tailored for both novices and seasoned professionals.
- Customizable Inputs: Effortlessly adjust assumptions to suit your financial analysis.
- Real-Time Feedback: Observe immediate changes in Jointown’s valuation as you modify inputs.
- Pre-Loaded Data: Comes equipped with Jointown’s current financial metrics for swift evaluations.
- Preferred by Experts: Utilized by investors and analysts for data-driven decision-making.
Who Would Benefit from This Product?
- Investors: Accurately assess the fair value of Jointown Pharmaceutical Group Co., Ltd (600998SS) before making investment choices.
- CFOs: Utilize a high-quality DCF model for financial analysis and reporting.
- Consultants: Effortlessly modify the template for client valuation reports.
- Entrepreneurs: Discover financial modeling techniques employed by leading pharmaceutical firms.
- Educators: Employ it as a teaching resource to illustrate valuation principles.
Overview of the Template's Features
- Detailed DCF Model: An editable template featuring thorough valuation calculations.
- Real-World Data: Jointown Pharmaceutical Group Co., Ltd’s historical and projected financials preloaded for comprehensive analysis.
- Customizable Parameters: Modify WACC, growth rates, and tax assumptions to explore different scenarios.
- Financial Statements: Complete annual and quarterly breakdowns for in-depth insights.
- Key Ratios: Integrated analysis for profitability, efficiency, and leverage metrics.
- Interactive Dashboard with Visual Outputs: Visual tools including charts and tables for clear and actionable results.
Disclaimer
All information, articles, and product details provided on this website are for general informational and educational purposes only. We do not claim any ownership over, nor do we intend to infringe upon, any trademarks, copyrights, logos, brand names, or other intellectual property mentioned or depicted on this site. Such intellectual property remains the property of its respective owners, and any references here are made solely for identification or informational purposes, without implying any affiliation, endorsement, or partnership.
We make no representations or warranties, express or implied, regarding the accuracy, completeness, or suitability of any content or products presented. Nothing on this website should be construed as legal, tax, investment, financial, medical, or other professional advice. In addition, no part of this site—including articles or product references—constitutes a solicitation, recommendation, endorsement, advertisement, or offer to buy or sell any securities, franchises, or other financial instruments, particularly in jurisdictions where such activity would be unlawful.
All content is of a general nature and may not address the specific circumstances of any individual or entity. It is not a substitute for professional advice or services. Any actions you take based on the information provided here are strictly at your own risk. You accept full responsibility for any decisions or outcomes arising from your use of this website and agree to release us from any liability in connection with your use of, or reliance upon, the content or products found herein.