
|
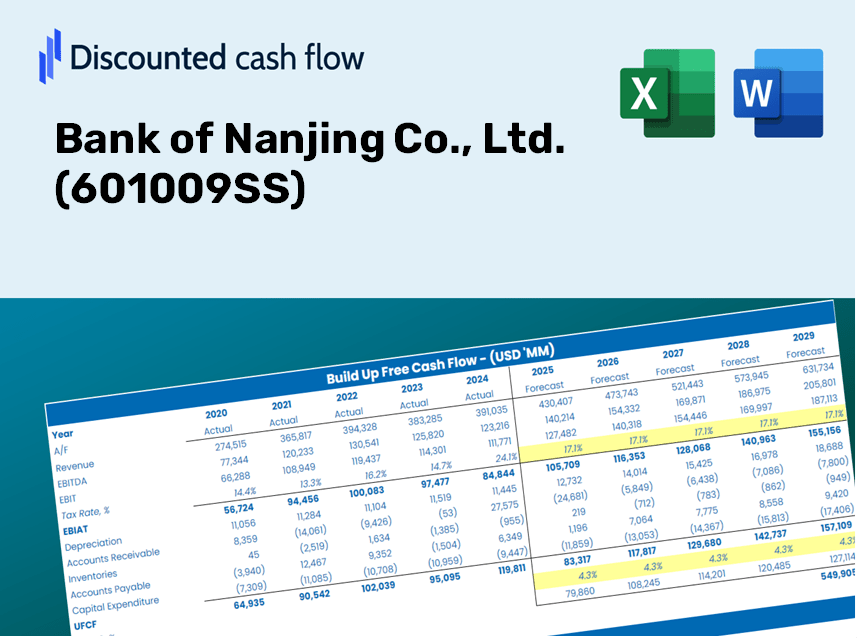
Bank of Nanjing Co., Ltd. (601009.SS) DCF Valuation |
Fully Editable: Tailor To Your Needs In Excel Or Sheets
Professional Design: Trusted, Industry-Standard Templates
Investor-Approved Valuation Models
MAC/PC Compatible, Fully Unlocked
No Expertise Is Needed; Easy To Follow
Bank of Nanjing Co., Ltd. (601009.SS) Bundle
Designed for accuracy, our (601009SS) DCF Calculator enables you to assess the valuation of Bank of Nanjing Co., Ltd. using real-world financial data, while offering complete flexibility to modify all essential parameters for improved projections.
Discounted Cash Flow (DCF) - (USD MM)
| Year | AY1 2020 |
AY2 2021 |
AY3 2022 |
AY4 2023 |
AY5 2024 |
FY1 2025 |
FY2 2026 |
FY3 2027 |
FY4 2028 |
FY5 2029 |
|---|---|---|---|---|---|---|---|---|---|---|
| Revenue | 25,792.6 | 31,574.7 | 35,243.1 | 35,620.2 | 39,376.4 | 43,870.4 | 48,877.2 | 54,455.5 | 60,670.4 | 67,594.6 |
| Revenue Growth, % | 0 | 22.42 | 11.62 | 1.07 | 10.55 | 11.41 | 11.41 | 11.41 | 11.41 | 11.41 |
| EBITDA | 15,579.1 | 19,782.7 | .0 | 22,049.7 | .0 | 16,228.3 | 18,080.4 | 20,143.9 | 22,442.8 | 25,004.2 |
| EBITDA, % | 60.4 | 62.65 | 0 | 61.9 | 0 | 36.99 | 36.99 | 36.99 | 36.99 | 36.99 |
| Depreciation | 751.4 | 1,093.3 | 1,210.0 | 1,009.6 | 1,520.5 | 1,448.2 | 1,613.4 | 1,797.6 | 2,002.7 | 2,231.3 |
| Depreciation, % | 2.91 | 3.46 | 3.43 | 2.83 | 3.86 | 3.3 | 3.3 | 3.3 | 3.3 | 3.3 |
| EBIT | 14,827.7 | 18,689.4 | -1,210.0 | 21,040.1 | -1,520.5 | 14,780.1 | 16,467.0 | 18,346.3 | 20,440.1 | 22,772.9 |
| EBIT, % | 57.49 | 59.19 | -3.43 | 59.07 | -3.86 | 33.69 | 33.69 | 33.69 | 33.69 | 33.69 |
| Total Cash | 127,653.6 | 131,448.8 | 151,961.0 | 38,919.0 | 191,324.9 | 43,870.4 | 48,877.2 | 54,455.5 | 60,670.4 | 67,594.6 |
| Total Cash, percent | .0 | .0 | .0 | .0 | .0 | .0 | .0 | .0 | .0 | .0 |
| Account Receivables | .0 | .0 | .0 | .0 | .0 | .0 | .0 | .0 | .0 | .0 |
| Account Receivables, % | 0 | 0 | 0 | 0 | 0 | 0 | 0 | 0 | 0 | 0 |
| Inventories | .0 | .0 | .0 | .0 | .0 | .0 | .0 | .0 | .0 | .0 |
| Inventories, % | 0 | 0 | 0 | 0 | 0 | 0 | 0 | 0 | 0 | 0 |
| Accounts Payable | .0 | .0 | .0 | .0 | .0 | .0 | .0 | .0 | .0 | .0 |
| Accounts Payable, % | 0 | 0 | 0 | 0 | 0 | 0 | 0 | 0 | 0 | 0 |
| Capital Expenditure | -1,297.9 | -2,247.6 | -798.1 | -2,113.8 | -1,324.9 | -2,080.7 | -2,318.1 | -2,582.7 | -2,877.5 | -3,205.9 |
| Capital Expenditure, % | -5.03 | -7.12 | -2.26 | -5.93 | -3.36 | -4.74 | -4.74 | -4.74 | -4.74 | -4.74 |
| Tax Rate, % | 18.16 | 18.16 | 18.16 | 18.16 | 18.16 | 18.16 | 18.16 | 18.16 | 18.16 | 18.16 |
| EBITAT | 12,531.5 | 15,447.6 | -1,024.6 | 17,796.7 | -1,244.4 | 12,364.2 | 13,775.3 | 15,347.5 | 17,099.1 | 19,050.5 |
| Depreciation | ||||||||||
| Changes in Account Receivables | ||||||||||
| Changes in Inventories | ||||||||||
| Changes in Accounts Payable | ||||||||||
| Capital Expenditure | ||||||||||
| UFCF | 11,985.0 | 14,293.3 | -612.7 | 16,692.5 | -1,048.8 | 11,731.7 | 13,070.6 | 14,562.4 | 16,224.3 | 18,076.0 |
| WACC, % | 5.34 | 5.24 | 5.35 | 5.34 | 5.19 | 5.29 | 5.29 | 5.29 | 5.29 | 5.29 |
| PV UFCF | ||||||||||
| SUM PV UFCF | 62,576.2 | |||||||||
| Long Term Growth Rate, % | 2.00 | |||||||||
| Free cash flow (T + 1) | 18,437 | |||||||||
| Terminal Value | 560,173 | |||||||||
| Present Terminal Value | 432,870 | |||||||||
| Enterprise Value | 495,446 | |||||||||
| Net Debt | -191,325 | |||||||||
| Equity Value | 686,771 | |||||||||
| Diluted Shares Outstanding, MM | 12,532 | |||||||||
| Equity Value Per Share | 54.80 |
What You Will Receive
- Flexible Forecast Inputs: Modify key assumptions (growth %, margins, WACC) effortlessly to explore various scenarios.
- Comprehensive Data: Bank of Nanjing’s financial data pre-loaded to facilitate your analysis.
- Automated DCF Calculations: The template computes Net Present Value (NPV) and intrinsic value on your behalf.
- Tailored and Professional Design: An elegant Excel model that meets your valuation requirements.
- Designed for Analysts and Investors: Perfect for evaluating projections, validating strategies, and enhancing efficiency.
Key Features of Bank of Nanjing Co., Ltd. (601009SS)
- Customizable Financial Inputs: Adjust key variables such as revenue growth, net income margin, and capital investment.
- Instant DCF Valuation: Quickly computes intrinsic value, net present value, and additional financial metrics.
- High-Precision Accuracy: Leverages real financial data from Bank of Nanjing for dependable valuation results.
- Seamless Scenario Analysis: Easily explore different financial scenarios and evaluate outcomes side by side.
- Efficiency Booster: Avoids the hassle of creating intricate valuation models from the ground up.
How It Operates
- Download the Template: Gain immediate access to the Excel-based Bank of Nanjing Co., Ltd. (601009SS) DCF Calculator.
- Input Your Assumptions: Modify the yellow-highlighted cells for growth rates, WACC, margins, and additional variables.
- Instant Calculations: The model will automatically refresh the intrinsic value of Bank of Nanjing Co., Ltd. (601009SS).
- Test Scenarios: Experiment with various assumptions to assess potential changes in valuation.
- Analyze and Decide: Utilize the results to inform your investment strategies or financial assessments.
Why Select the Bank of Nanjing Co., Ltd. ([601009SS]) Calculator?
- Time Efficiency: Skip the hassle of building a DCF model from scratch – it's immediately available for use.
- Enhanced Accuracy: Dependable financial data and established formulas minimize valuation errors.
- Completely Customizable: Adjust the model to suit your own assumptions and forecasts.
- User-Friendly: Intuitive charts and outputs simplify the analysis of your results.
- Preferred by Professionals: Crafted for experts who prioritize precision and ease of use.
Who Should Use This Product?
- Individual Investors: Make informed decisions regarding the purchase or sale of Bank of Nanjing Co., Ltd. (601009SS) stock.
- Financial Analysts: Enhance valuation processes with accessible financial models tailored for Bank of Nanjing Co., Ltd. (601009SS).
- Consultants: Provide clients with timely and precise valuation insights for Bank of Nanjing Co., Ltd. (601009SS).
- Business Owners: Gain insights into how major companies like Bank of Nanjing Co., Ltd. (601009SS) are valued to inform your strategic decisions.
- Finance Students: Master valuation methods through the analysis of real-world data and case studies involving Bank of Nanjing Co., Ltd. (601009SS).
What the Template Contains
- Operating and Balance Sheet Data: Pre-filled historical data and forecasts for Bank of Nanjing Co., Ltd. (601009SS), including revenue, EBITDA, EBIT, and capital expenditures.
- WACC Calculation: A dedicated sheet for the Weighted Average Cost of Capital (WACC), featuring key parameters such as Beta, risk-free rate, and share price.
- DCF Valuation (Unlevered and Levered): Customizable Discounted Cash Flow models that present intrinsic value along with detailed calculations.
- Financial Statements: Pre-loaded financial statements (annual and quarterly) to facilitate comprehensive analysis.
- Key Ratios: A collection of profitability, leverage, and efficiency ratios specific to Bank of Nanjing Co., Ltd. (601009SS).
- Dashboard and Charts: A visual overview of valuation outputs and assumptions for straightforward result analysis.
Disclaimer
All information, articles, and product details provided on this website are for general informational and educational purposes only. We do not claim any ownership over, nor do we intend to infringe upon, any trademarks, copyrights, logos, brand names, or other intellectual property mentioned or depicted on this site. Such intellectual property remains the property of its respective owners, and any references here are made solely for identification or informational purposes, without implying any affiliation, endorsement, or partnership.
We make no representations or warranties, express or implied, regarding the accuracy, completeness, or suitability of any content or products presented. Nothing on this website should be construed as legal, tax, investment, financial, medical, or other professional advice. In addition, no part of this site—including articles or product references—constitutes a solicitation, recommendation, endorsement, advertisement, or offer to buy or sell any securities, franchises, or other financial instruments, particularly in jurisdictions where such activity would be unlawful.
All content is of a general nature and may not address the specific circumstances of any individual or entity. It is not a substitute for professional advice or services. Any actions you take based on the information provided here are strictly at your own risk. You accept full responsibility for any decisions or outcomes arising from your use of this website and agree to release us from any liability in connection with your use of, or reliance upon, the content or products found herein.