
|
Caitong Securities Co.,Ltd. (601108.SS) DCF Valuation |
Fully Editable: Tailor To Your Needs In Excel Or Sheets
Professional Design: Trusted, Industry-Standard Templates
Investor-Approved Valuation Models
MAC/PC Compatible, Fully Unlocked
No Expertise Is Needed; Easy To Follow
Caitong Securities Co.,Ltd. (601108.SS) Bundle
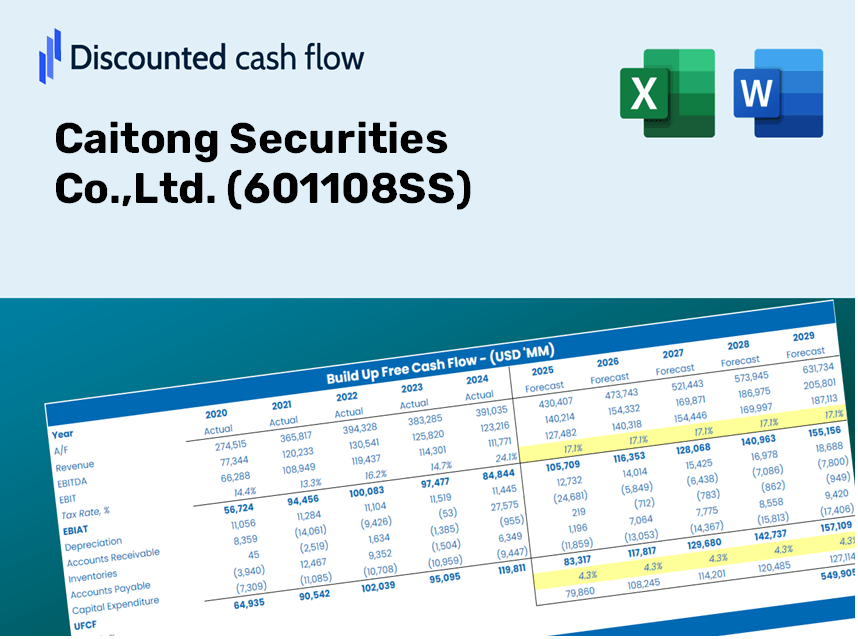
As an investor or analyst, this (601108SS) DCF Calculator is your essential tool for accurate valuation. It comes preloaded with real data from Caitong Securities Co., Ltd., allowing you to adjust forecasts and instantly view the effects.
Discounted Cash Flow (DCF) - (USD MM)
| Year | AY1 2020 |
AY2 2021 |
AY3 2022 |
AY4 2023 |
AY5 2024 |
FY1 2025 |
FY2 2026 |
FY3 2027 |
FY4 2028 |
FY5 2029 |
|---|---|---|---|---|---|---|---|---|---|---|
| Revenue | 5,878.8 | 7,366.6 | 4,110.0 | 6,371.6 | 7,645.7 | 8,718.4 | 9,941.7 | 11,336.6 | 12,927.2 | 14,741.0 |
| Revenue Growth, % | 0 | 25.31 | -44.21 | 55.03 | 20 | 14.03 | 14.03 | 14.03 | 14.03 | 14.03 |
| EBITDA | .0 | 3,377.1 | 2,962.4 | .0 | .0 | 2,056.2 | 2,344.7 | 2,673.7 | 3,048.8 | 3,476.6 |
| EBITDA, % | 0 | 45.84 | 72.08 | 0 | 0 | 23.58 | 23.58 | 23.58 | 23.58 | 23.58 |
| Depreciation | 146.0 | 347.6 | 3,308.0 | 338.2 | 311.1 | 1,692.5 | 1,930.0 | 2,200.8 | 2,509.6 | 2,861.7 |
| Depreciation, % | 2.48 | 4.72 | 80.49 | 5.31 | 4.07 | 19.41 | 19.41 | 19.41 | 19.41 | 19.41 |
| EBIT | -146.0 | 3,029.5 | -345.6 | -338.2 | -311.1 | 363.7 | 414.7 | 472.9 | 539.2 | 614.9 |
| EBIT, % | -2.48 | 41.12 | -8.41 | -5.31 | -4.07 | 4.17 | 4.17 | 4.17 | 4.17 | 4.17 |
| Total Cash | 40,504.9 | 6,427.3 | 4,298.1 | 44,103.0 | 59,000.0 | 8,496.1 | 9,688.2 | 11,047.5 | 12,597.5 | 14,365.1 |
| Total Cash, percent | .0 | .0 | .0 | .0 | .0 | .0 | .0 | .0 | .0 | .0 |
| Account Receivables | 258.1 | 866.5 | 18,469.2 | 2,182.0 | 347.7 | 2,701.8 | 3,080.9 | 3,513.1 | 4,006.1 | 4,568.1 |
| Account Receivables, % | 4.39 | 11.76 | 449.38 | 34.25 | 4.55 | 30.99 | 30.99 | 30.99 | 30.99 | 30.99 |
| Inventories | .0 | 27,845.2 | 22,767.3 | 27,627.4 | .0 | 5,231.1 | 5,965.0 | 6,801.9 | 7,756.3 | 8,844.6 |
| Inventories, % | 0 | 377.99 | 553.95 | 433.6 | 0 | 60 | 60 | 60 | 60 | 60 |
| Accounts Payable | 641.1 | 1,035.6 | 802.6 | 1,519.4 | 1,781.6 | 1,597.9 | 1,822.1 | 2,077.7 | 2,369.3 | 2,701.7 |
| Accounts Payable, % | 10.9 | 14.06 | 19.53 | 23.85 | 23.3 | 18.33 | 18.33 | 18.33 | 18.33 | 18.33 |
| Capital Expenditure | -263.3 | -194.8 | -144.9 | -175.4 | -2,507.7 | -805.6 | -918.6 | -1,047.5 | -1,194.4 | -1,362.0 |
| Capital Expenditure, % | -4.48 | -2.64 | -3.52 | -2.75 | -32.8 | -9.24 | -9.24 | -9.24 | -9.24 | -9.24 |
| Tax Rate, % | 15.57 | 15.57 | 15.57 | 15.57 | 15.57 | 15.57 | 15.57 | 15.57 | 15.57 | 15.57 |
| EBITAT | -120.9 | 2,566.2 | -330.9 | -291.6 | -262.6 | 315.6 | 359.8 | 410.3 | 467.9 | 533.6 |
| Depreciation | ||||||||||
| Changes in Account Receivables | ||||||||||
| Changes in Inventories | ||||||||||
| Changes in Accounts Payable | ||||||||||
| Capital Expenditure | ||||||||||
| UFCF | 144.9 | -25,340.0 | -9,925.6 | 12,015.2 | 27,264.7 | -6,566.3 | 482.4 | 550.1 | 627.3 | 715.3 |
| WACC, % | 6.51 | 6.57 | 6.89 | 6.61 | 6.56 | 6.63 | 6.63 | 6.63 | 6.63 | 6.63 |
| PV UFCF | ||||||||||
| SUM PV UFCF | -4,275.8 | |||||||||
| Long Term Growth Rate, % | 2.00 | |||||||||
| Free cash flow (T + 1) | 730 | |||||||||
| Terminal Value | 15,759 | |||||||||
| Present Terminal Value | 11,433 | |||||||||
| Enterprise Value | 7,157 | |||||||||
| Net Debt | 17,726 | |||||||||
| Equity Value | -10,569 | |||||||||
| Diluted Shares Outstanding, MM | 4,775 | |||||||||
| Equity Value Per Share | -2.21 |
What You Will Receive
- Customizable Excel Template: An interactive Excel-based DCF Calculator featuring pre-populated financial data for Caitong Securities Co., Ltd. (601108SS).
- Reliable Data: Access to historical performance metrics and future projections (highlighted in the yellow cells).
- Adaptable Forecasting: Modify key assumptions such as revenue growth rates, EBITDA percentages, and WACC.
- Real-Time Calculations: Instantly observe how your inputs affect the valuation of Caitong Securities Co., Ltd. (601108SS).
- Expert Financial Tool: Designed for use by investors, CFOs, consultants, and financial analysts.
- Intuitive Interface: Organized for clarity and simplicity, complete with step-by-step guidance.
Key Features
- Customizable Forecast Inputs: Adjust essential parameters such as revenue growth, EBITDA margin, and capital expenditures.
- Instant DCF Valuation: Provides immediate calculations of intrinsic value, NPV, and additional metrics.
- High Precision Analytics: Employs Caitong Securities Co., Ltd.’s actual financial data to ensure accurate valuation results.
- Effortless Scenario Analysis: Easily evaluate various assumptions and analyze their respective outcomes.
- Efficiency Booster: Remove the hassle of constructing detailed valuation models from the ground up.
How It Works
- Step 1: Download the preconfigured Excel template featuring Caitong Securities Co., Ltd.'s data.
- Step 2: Navigate through the pre-filled sheets to familiarize yourself with the essential metrics.
- Step 3: Adjust forecasts and assumptions in the editable yellow cells (WACC, growth, margins).
- Step 4: Instantly see the updated results, including the intrinsic value of Caitong Securities Co., Ltd. (601108SS).
- Step 5: Use the outputs to make informed investment choices or create detailed reports.
Why Opt for Caitong Securities Co., Ltd. ([601108SS])?
- Reliable Data: Utilize authentic financial metrics for trustworthy valuation outcomes.
- Tailored Options: Modify essential factors such as growth rates, WACC, and tax rates to fit your forecasts.
- Efficiency Boost: Ready-to-use calculations save you from starting from ground zero.
- Expert-Level Resource: Crafted for investors, analysts, and consulting professionals.
- Easy to Use: Designed with an intuitive interface and clear, step-by-step guidance for all users.
Who Can Benefit from Caitong Securities Co., Ltd. (601108SS)?
- Finance Students: Master analysis techniques and apply them to real market data.
- Academics: Integrate industry-standard valuation models into programs or studies.
- Investors: Validate your investment strategies and assess performance metrics for Caitong Securities Co., Ltd. (601108SS).
- Analysts: Enhance your analysis process with a ready-made, adaptable DCF model.
- Small Business Owners: Understand how large firms like Caitong Securities Co., Ltd. (601108SS) are evaluated in the market.
Contents of the Template
- Preloaded 601108SS Data: Historical and projected financial information, covering revenue, EBIT, and capital expenditures.
- DCF and WACC Models: Professional-quality spreadsheets designed for calculating intrinsic value and Weighted Average Cost of Capital.
- Editable Inputs: Cells highlighted in yellow for customizing revenue growth rates, tax percentages, and discount rates.
- Financial Statements: Detailed annual and quarterly financial reports for in-depth analysis.
- Key Ratios: Metrics related to profitability, leverage, and efficiency for performance evaluation.
- Dashboard and Charts: Visual representations of valuation results and underlying assumptions.
Disclaimer
All information, articles, and product details provided on this website are for general informational and educational purposes only. We do not claim any ownership over, nor do we intend to infringe upon, any trademarks, copyrights, logos, brand names, or other intellectual property mentioned or depicted on this site. Such intellectual property remains the property of its respective owners, and any references here are made solely for identification or informational purposes, without implying any affiliation, endorsement, or partnership.
We make no representations or warranties, express or implied, regarding the accuracy, completeness, or suitability of any content or products presented. Nothing on this website should be construed as legal, tax, investment, financial, medical, or other professional advice. In addition, no part of this site—including articles or product references—constitutes a solicitation, recommendation, endorsement, advertisement, or offer to buy or sell any securities, franchises, or other financial instruments, particularly in jurisdictions where such activity would be unlawful.
All content is of a general nature and may not address the specific circumstances of any individual or entity. It is not a substitute for professional advice or services. Any actions you take based on the information provided here are strictly at your own risk. You accept full responsibility for any decisions or outcomes arising from your use of this website and agree to release us from any liability in connection with your use of, or reliance upon, the content or products found herein.