
|
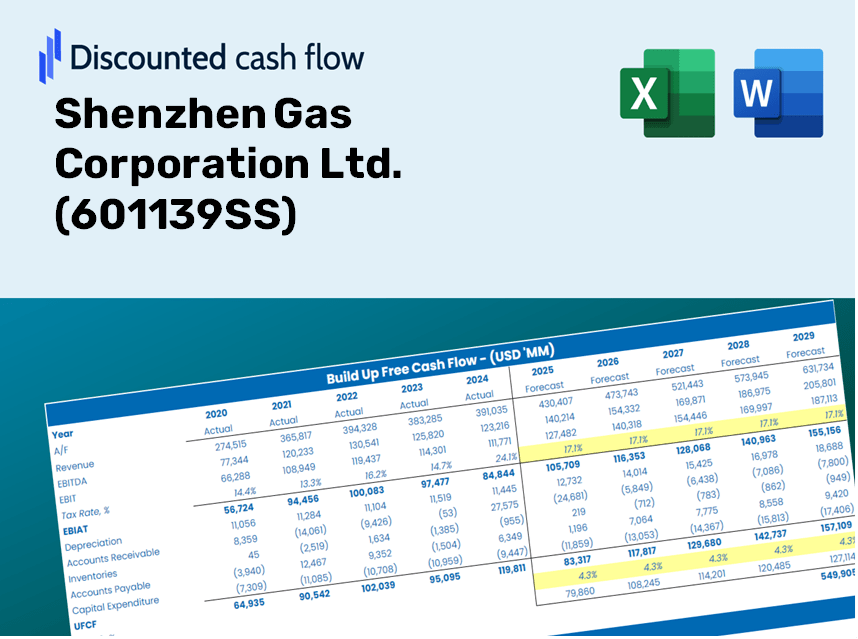
Shenzhen Gas Corporation Ltd. (601139.SS) DCF Valuation |
Fully Editable: Tailor To Your Needs In Excel Or Sheets
Professional Design: Trusted, Industry-Standard Templates
Investor-Approved Valuation Models
MAC/PC Compatible, Fully Unlocked
No Expertise Is Needed; Easy To Follow
Shenzhen Gas Corporation Ltd. (601139.SS) Bundle
Streamline your analysis and improve precision with our (601139SS) DCF Calculator! Utilizing actual data from Shenzhen Gas Corporation Ltd. and customizable assumptions, this tool empowers you to forecast, assess, and value (601139SS) just like a seasoned investor.
Discounted Cash Flow (DCF) - (USD MM)
| Year | AY1 2020 |
AY2 2021 |
AY3 2022 |
AY4 2023 |
AY5 2024 |
FY1 2025 |
FY2 2026 |
FY3 2027 |
FY4 2028 |
FY5 2029 |
|---|---|---|---|---|---|---|---|---|---|---|
| Revenue | 15,014.8 | 21,414.7 | 30,061.6 | 30,928.6 | 28,348.1 | 28,532.2 | 28,717.5 | 28,904.0 | 29,091.7 | 29,280.6 |
| Revenue Growth, % | 0 | 42.62 | 40.38 | 2.88 | -8.34 | 0.64937 | 0.64937 | 0.64937 | 0.64937 | 0.64937 |
| EBITDA | 2,583.6 | 2,705.2 | 2,924.9 | 3,265.5 | 3,050.4 | 3,474.5 | 3,497.1 | 3,519.8 | 3,542.6 | 3,565.7 |
| EBITDA, % | 17.21 | 12.63 | 9.73 | 10.56 | 10.76 | 12.18 | 12.18 | 12.18 | 12.18 | 12.18 |
| Depreciation | 820.7 | 847.5 | 1,216.1 | 1,356.4 | 994.4 | 1,219.0 | 1,226.9 | 1,234.9 | 1,242.9 | 1,251.0 |
| Depreciation, % | 5.47 | 3.96 | 4.05 | 4.39 | 3.51 | 4.27 | 4.27 | 4.27 | 4.27 | 4.27 |
| EBIT | 1,762.8 | 1,857.8 | 1,708.8 | 1,909.0 | 2,056.0 | 2,255.5 | 2,270.1 | 2,284.9 | 2,299.7 | 2,314.7 |
| EBIT, % | 11.74 | 8.68 | 5.68 | 6.17 | 7.25 | 7.91 | 7.91 | 7.91 | 7.91 | 7.91 |
| Total Cash | 3,981.3 | 3,226.3 | 3,305.2 | 5,836.4 | 5,711.5 | 5,226.8 | 5,260.8 | 5,294.9 | 5,329.3 | 5,363.9 |
| Total Cash, percent | .0 | .0 | .0 | .0 | .0 | .0 | .0 | .0 | .0 | .0 |
| Account Receivables | 935.2 | 3,544.9 | 3,948.7 | 4,397.4 | 4,717.4 | 3,810.6 | 3,835.3 | 3,860.2 | 3,885.3 | 3,910.5 |
| Account Receivables, % | 6.23 | 16.55 | 13.14 | 14.22 | 16.64 | 13.36 | 13.36 | 13.36 | 13.36 | 13.36 |
| Inventories | 354.6 | 1,396.1 | 2,264.8 | 1,948.1 | 1,101.0 | 1,517.8 | 1,527.6 | 1,537.6 | 1,547.5 | 1,557.6 |
| Inventories, % | 2.36 | 6.52 | 7.53 | 6.3 | 3.88 | 5.32 | 5.32 | 5.32 | 5.32 | 5.32 |
| Accounts Payable | 2,253.4 | 3,900.4 | 4,620.5 | 4,662.4 | 4,448.7 | 4,528.6 | 4,558.0 | 4,587.6 | 4,617.4 | 4,647.4 |
| Accounts Payable, % | 15.01 | 18.21 | 15.37 | 15.07 | 15.69 | 15.87 | 15.87 | 15.87 | 15.87 | 15.87 |
| Capital Expenditure | -978.4 | -2,253.5 | -2,660.6 | -3,948.0 | -3,370.5 | -2,884.3 | -2,903.0 | -2,921.9 | -2,940.8 | -2,959.9 |
| Capital Expenditure, % | -6.52 | -10.52 | -8.85 | -12.76 | -11.89 | -10.11 | -10.11 | -10.11 | -10.11 | -10.11 |
| Tax Rate, % | 20.46 | 20.46 | 20.46 | 20.46 | 20.46 | 20.46 | 20.46 | 20.46 | 20.46 | 20.46 |
| EBITAT | 1,383.3 | 1,371.5 | 1,260.3 | 1,460.2 | 1,635.3 | 1,723.5 | 1,734.7 | 1,746.0 | 1,757.3 | 1,768.7 |
| Depreciation | ||||||||||
| Changes in Account Receivables | ||||||||||
| Changes in Inventories | ||||||||||
| Changes in Accounts Payable | ||||||||||
| Capital Expenditure | ||||||||||
| UFCF | 2,189.2 | -2,038.8 | -736.6 | -1,221.4 | -427.5 | 628.2 | 53.4 | 53.8 | 54.1 | 54.5 |
| WACC, % | 4.85 | 4.79 | 4.79 | 4.83 | 4.87 | 4.83 | 4.83 | 4.83 | 4.83 | 4.83 |
| PV UFCF | ||||||||||
| SUM PV UFCF | 782.4 | |||||||||
| Long Term Growth Rate, % | 3.00 | |||||||||
| Free cash flow (T + 1) | 56 | |||||||||
| Terminal Value | 3,071 | |||||||||
| Present Terminal Value | 2,426 | |||||||||
| Enterprise Value | 3,209 | |||||||||
| Net Debt | 5,480 | |||||||||
| Equity Value | -2,271 | |||||||||
| Diluted Shares Outstanding, MM | 3,238 | |||||||||
| Equity Value Per Share | -0.70 |
What You Will Receive
- Pre-Filled Financial Model: Leverage Shenzhen Gas Corporation Ltd.'s actual data for accurate DCF valuation.
- Comprehensive Forecast Control: Modify revenue growth, profit margins, WACC, and other essential drivers.
- Real-Time Calculations: Automatic updates provide immediate feedback as you make adjustments.
- Investor-Ready Template: A polished Excel document crafted for high-quality valuation.
- Customizable and Reusable: Designed for adaptability, enabling extensive use for in-depth forecasts.
Key Features
- Customizable Forecast Inputs: Adjust essential parameters such as revenue growth, EBITDA %, and capital investments.
- Instant DCF Valuation: Quickly computes intrinsic value, NPV, and other financial metrics.
- High-Precision Accuracy: Leverages Shenzhen Gas Corporation Ltd.'s (601139SS) real-world financial data for credible valuation results.
- Effortless Scenario Analysis: Easily explore various assumptions and evaluate results side by side.
- Efficiency Booster: Remove the complexity of creating detailed valuation models from the ground up.
How It Functions
- Acquire the Template: Gain immediate access to the Excel-based Shenzhen Gas Corporation Ltd. (601139SS) DCF Calculator.
- Enter Your Assumptions: Modify the yellow-highlighted cells for growth rates, WACC, margins, and other factors.
- Automatic Calculations: The model refreshes the intrinsic value of Shenzhen Gas Corporation Ltd. (601139SS) instantly.
- Explore Scenarios: Test various assumptions to assess potential changes in valuation.
- Evaluate and Decide: Utilize the findings to inform your investment or financial strategy.
Why Choose This Calculator for Shenzhen Gas Corporation Ltd. (601139SS)?
- Designed for Industry Experts: An advanced tool utilized by analysts, CFOs, and financial consultants.
- Comprehensive Data: Historical and projected financials for Shenzhen Gas Corporation preloaded to ensure precision.
- Versatile Scenario Analysis: Effortlessly test various forecasts and assumptions.
- Concise Outputs: Automatically computes intrinsic value, NPV, and other essential metrics.
- User-Friendly: Step-by-step guidance makes navigation straightforward.
Who Can Benefit from Our Services?
- Finance Students: Explore valuation methodologies and implement them with actual data from Shenzhen Gas Corporation Ltd. (601139SS).
- Academics: Integrate industry-standard models into your teaching materials or research projects.
- Investors: Evaluate your own hypotheses and assess valuation results for Shenzhen Gas Corporation Ltd. (601139SS).
- Analysts: Enhance your analysis process with a customizable DCF model tailored for Shenzhen Gas Corporation Ltd. (601139SS).
- Small Business Owners: Understand the analytical approaches used for assessing large public companies like Shenzhen Gas Corporation Ltd. (601139SS).
Contents of the Template
- Pre-Filled Data: Contains Shenzhen Gas Corporation Ltd.'s historical financial information and forecasts.
- Discounted Cash Flow Model: An editable DCF valuation model equipped with automatic calculations.
- Weighted Average Cost of Capital (WACC): A dedicated worksheet for calculating WACC using your custom inputs.
- Key Financial Ratios: Evaluate Shenzhen Gas Corporation Ltd.'s profitability, efficiency, and leverage metrics.
- Customizable Inputs: Easily modify revenue growth, profit margins, and tax rates.
- Clear Dashboard: Visual representations and tables that summarize vital valuation results.
Disclaimer
All information, articles, and product details provided on this website are for general informational and educational purposes only. We do not claim any ownership over, nor do we intend to infringe upon, any trademarks, copyrights, logos, brand names, or other intellectual property mentioned or depicted on this site. Such intellectual property remains the property of its respective owners, and any references here are made solely for identification or informational purposes, without implying any affiliation, endorsement, or partnership.
We make no representations or warranties, express or implied, regarding the accuracy, completeness, or suitability of any content or products presented. Nothing on this website should be construed as legal, tax, investment, financial, medical, or other professional advice. In addition, no part of this site—including articles or product references—constitutes a solicitation, recommendation, endorsement, advertisement, or offer to buy or sell any securities, franchises, or other financial instruments, particularly in jurisdictions where such activity would be unlawful.
All content is of a general nature and may not address the specific circumstances of any individual or entity. It is not a substitute for professional advice or services. Any actions you take based on the information provided here are strictly at your own risk. You accept full responsibility for any decisions or outcomes arising from your use of this website and agree to release us from any liability in connection with your use of, or reliance upon, the content or products found herein.