
|
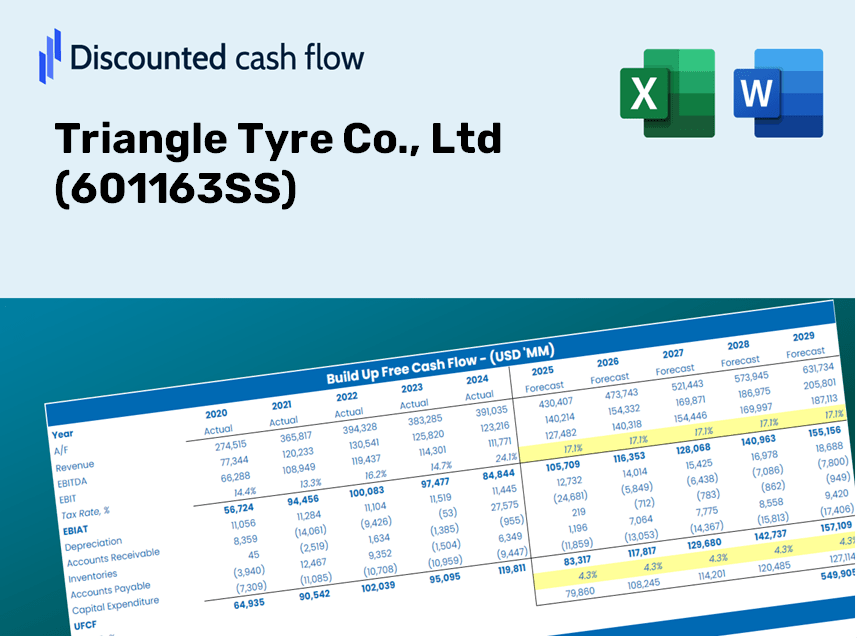
Triangle Tyre Co., Ltd (601163.SS) DCF Valuation |
Fully Editable: Tailor To Your Needs In Excel Or Sheets
Professional Design: Trusted, Industry-Standard Templates
Investor-Approved Valuation Models
MAC/PC Compatible, Fully Unlocked
No Expertise Is Needed; Easy To Follow
Triangle Tyre Co., Ltd (601163.SS) Bundle
Looking to assess the intrinsic value of Triangle Tyre Co., Ltd? Our (601163SS) DCF Calculator integrates real-world data with extensive customization options, enabling you to refine your forecasts and make more informed investment choices.
Discounted Cash Flow (DCF) - (USD MM)
| Year | AY1 2020 |
AY2 2021 |
AY3 2022 |
AY4 2023 |
AY5 2024 |
FY1 2025 |
FY2 2026 |
FY3 2027 |
FY4 2028 |
FY5 2029 |
|---|---|---|---|---|---|---|---|---|---|---|
| Revenue | 8,535.3 | 8,954.4 | 9,220.1 | 10,421.7 | 10,155.7 | 10,621.8 | 11,109.3 | 11,619.1 | 12,152.4 | 12,710.1 |
| Revenue Growth, % | 0 | 4.91 | 2.97 | 13.03 | -2.55 | 4.59 | 4.59 | 4.59 | 4.59 | 4.59 |
| EBITDA | 1,555.2 | 894.1 | 970.3 | 1,724.0 | 1,327.4 | 1,451.8 | 1,518.5 | 1,588.1 | 1,661.0 | 1,737.3 |
| EBITDA, % | 18.22 | 9.99 | 10.52 | 16.54 | 13.07 | 13.67 | 13.67 | 13.67 | 13.67 | 13.67 |
| Depreciation | 465.3 | 443.0 | 407.0 | 402.5 | 406.9 | 481.9 | 504.0 | 527.1 | 551.3 | 576.6 |
| Depreciation, % | 5.45 | 4.95 | 4.41 | 3.86 | 4.01 | 4.54 | 4.54 | 4.54 | 4.54 | 4.54 |
| EBIT | 1,090.0 | 451.1 | 563.2 | 1,321.5 | 920.4 | 970.0 | 1,014.5 | 1,061.1 | 1,109.7 | 1,160.7 |
| EBIT, % | 12.77 | 5.04 | 6.11 | 12.68 | 9.06 | 9.13 | 9.13 | 9.13 | 9.13 | 9.13 |
| Total Cash | 3,408.3 | 1,734.9 | 2,741.1 | 9,719.0 | 2,458.4 | 4,386.8 | 4,588.1 | 4,798.7 | 5,018.9 | 5,249.3 |
| Total Cash, percent | .0 | .0 | .0 | .0 | .0 | .0 | .0 | .0 | .0 | .0 |
| Account Receivables | 1,752.6 | 1,623.0 | 1,667.2 | 1,840.6 | 2,078.5 | 2,015.4 | 2,107.9 | 2,204.6 | 2,305.8 | 2,411.6 |
| Account Receivables, % | 20.53 | 18.13 | 18.08 | 17.66 | 20.47 | 18.97 | 18.97 | 18.97 | 18.97 | 18.97 |
| Inventories | 873.4 | 1,345.0 | 1,398.6 | 1,109.7 | 1,193.1 | 1,334.5 | 1,395.7 | 1,459.8 | 1,526.8 | 1,596.9 |
| Inventories, % | 10.23 | 15.02 | 15.17 | 10.65 | 11.75 | 12.56 | 12.56 | 12.56 | 12.56 | 12.56 |
| Accounts Payable | 3,344.1 | 3,390.6 | 3,860.9 | 3,557.1 | 3,712.5 | 4,027.9 | 4,212.8 | 4,406.1 | 4,608.3 | 4,819.8 |
| Accounts Payable, % | 39.18 | 37.87 | 41.87 | 34.13 | 36.56 | 37.92 | 37.92 | 37.92 | 37.92 | 37.92 |
| Capital Expenditure | -61.4 | -109.9 | -79.1 | -107.3 | -315.1 | -147.4 | -154.1 | -161.2 | -168.6 | -176.3 |
| Capital Expenditure, % | -0.71971 | -1.23 | -0.85757 | -1.03 | -3.1 | -1.39 | -1.39 | -1.39 | -1.39 | -1.39 |
| Tax Rate, % | 12 | 12 | 12 | 12 | 12 | 12 | 12 | 12 | 12 | 12 |
| EBITAT | 944.7 | 398.2 | 499.1 | 1,144.9 | 810.0 | 850.1 | 889.1 | 929.9 | 972.6 | 1,017.2 |
| Depreciation | ||||||||||
| Changes in Account Receivables | ||||||||||
| Changes in Inventories | ||||||||||
| Changes in Accounts Payable | ||||||||||
| Capital Expenditure | ||||||||||
| UFCF | 2,066.6 | 435.7 | 1,199.5 | 1,251.8 | 736.0 | 1,421.8 | 1,270.0 | 1,328.3 | 1,389.3 | 1,453.0 |
| WACC, % | 7.49 | 7.5 | 7.5 | 7.49 | 7.5 | 7.5 | 7.5 | 7.5 | 7.5 | 7.5 |
| PV UFCF | ||||||||||
| SUM PV UFCF | 5,543.3 | |||||||||
| Long Term Growth Rate, % | 3.50 | |||||||||
| Free cash flow (T + 1) | 1,504 | |||||||||
| Terminal Value | 37,603 | |||||||||
| Present Terminal Value | 26,193 | |||||||||
| Enterprise Value | 31,737 | |||||||||
| Net Debt | -1,201 | |||||||||
| Equity Value | 32,938 | |||||||||
| Diluted Shares Outstanding, MM | 799 | |||||||||
| Equity Value Per Share | 41.22 |
Benefits You Will Receive
- Authentic Triangle Tyre Financials: Access to both historical data and future forecasts for precise valuation.
- Customizable Inputs: Adjust key metrics such as WACC, tax rates, revenue growth, and capital expenditures.
- Instant Calculations: Dynamic calculations for intrinsic value and NPV.
- Scenario Analysis: Explore various scenarios to assess Triangle Tyre's future performance.
- User-Friendly Design: Crafted for experts but easy for newcomers to navigate.
Key Features
- Pre-Loaded Data: Historical financial statements and pre-filled forecasts for Triangle Tyre Co., Ltd (601163SS).
- Fully Adjustable Inputs: Customize WACC, tax rates, revenue growth, and EBITDA margins.
- Instant Results: Watch the intrinsic value of Triangle Tyre Co., Ltd (601163SS) update in real-time.
- Clear Visual Outputs: Dashboard charts illustrate valuation results and essential metrics.
- Built for Accuracy: A reliable tool designed for analysts, investors, and finance professionals.
How It Works
- Step 1: Download the Excel spreadsheet.
- Step 2: Review the pre-filled data for Triangle Tyre Co., Ltd (601163SS), including historical and projected figures.
- Step 3: Modify key assumptions (highlighted in yellow) as per your analysis.
- Step 4: Observe the automatic recalculations for Triangle Tyre Co., Ltd (601163SS)'s intrinsic value.
- Step 5: Utilize the results for your investment strategies or financial reporting.
Why Opt for This Calculator?
- User-Friendly Interface: Tailored for both novices and seasoned professionals.
- Customizable Inputs: Effortlessly adjust parameters to suit your analysis.
- Real-Time Updates: Instantly see the impact on Triangle Tyre's valuation with any input changes.
- Preloaded Data: Comes equipped with Triangle Tyre’s (601163SS) actual financial information for swift assessments.
- Relied Upon by Experts: Utilized by investors and analysts for informed decision-making.
Who Can Benefit from This Product?
- Investors: Accurately assess the fair value of Triangle Tyre Co., Ltd (601163SS) prior to making investment choices.
- CFOs: Utilize a top-tier DCF model for comprehensive financial reporting and analysis related to Triangle Tyre Co., Ltd (601163SS).
- Consultants: Easily tailor the template for valuation reports tailored to clients focusing on Triangle Tyre Co., Ltd (601163SS).
- Entrepreneurs: Discover financial modeling insights similar to those employed by leading companies in the industry, like Triangle Tyre Co., Ltd (601163SS).
- Educators: Employ this tool in teaching to illustrate effective valuation methods relevant to Triangle Tyre Co., Ltd (601163SS).
Contents of the Template
- Operating and Balance Sheet Data: Pre-filled historical data and forecasts for Triangle Tyre Co., Ltd (601163SS), including revenue, EBITDA, EBIT, and capital expenditures.
- WACC Calculation: A dedicated sheet for calculating the Weighted Average Cost of Capital (WACC), featuring parameters such as Beta, risk-free rate, and share price.
- DCF Valuation (Unlevered and Levered): Customizable Discounted Cash Flow models that illustrate intrinsic value, complete with detailed calculations.
- Financial Statements: Pre-loaded annual and quarterly financial statements to facilitate comprehensive analysis.
- Key Ratios: Provides profitability, leverage, and efficiency ratios specific to Triangle Tyre Co., Ltd (601163SS).
- Dashboard and Charts: A visual summary of valuation outputs and assumptions, designed for straightforward result analysis.
Disclaimer
All information, articles, and product details provided on this website are for general informational and educational purposes only. We do not claim any ownership over, nor do we intend to infringe upon, any trademarks, copyrights, logos, brand names, or other intellectual property mentioned or depicted on this site. Such intellectual property remains the property of its respective owners, and any references here are made solely for identification or informational purposes, without implying any affiliation, endorsement, or partnership.
We make no representations or warranties, express or implied, regarding the accuracy, completeness, or suitability of any content or products presented. Nothing on this website should be construed as legal, tax, investment, financial, medical, or other professional advice. In addition, no part of this site—including articles or product references—constitutes a solicitation, recommendation, endorsement, advertisement, or offer to buy or sell any securities, franchises, or other financial instruments, particularly in jurisdictions where such activity would be unlawful.
All content is of a general nature and may not address the specific circumstances of any individual or entity. It is not a substitute for professional advice or services. Any actions you take based on the information provided here are strictly at your own risk. You accept full responsibility for any decisions or outcomes arising from your use of this website and agree to release us from any liability in connection with your use of, or reliance upon, the content or products found herein.