
|
Guangzhou Port Company Limited (601228.SS) DCF Valuation |
Fully Editable: Tailor To Your Needs In Excel Or Sheets
Professional Design: Trusted, Industry-Standard Templates
Investor-Approved Valuation Models
MAC/PC Compatible, Fully Unlocked
No Expertise Is Needed; Easy To Follow
Guangzhou Port Company Limited (601228.SS) Bundle
Discover the true potential of Guangzhou Port Company Limited (601228SS) with our advanced DCF Calculator! Tailor key assumptions, explore various scenarios, and evaluate how adjustments affect the valuation of Guangzhou Port Company Limited (601228SS) – all within a convenient Excel template.
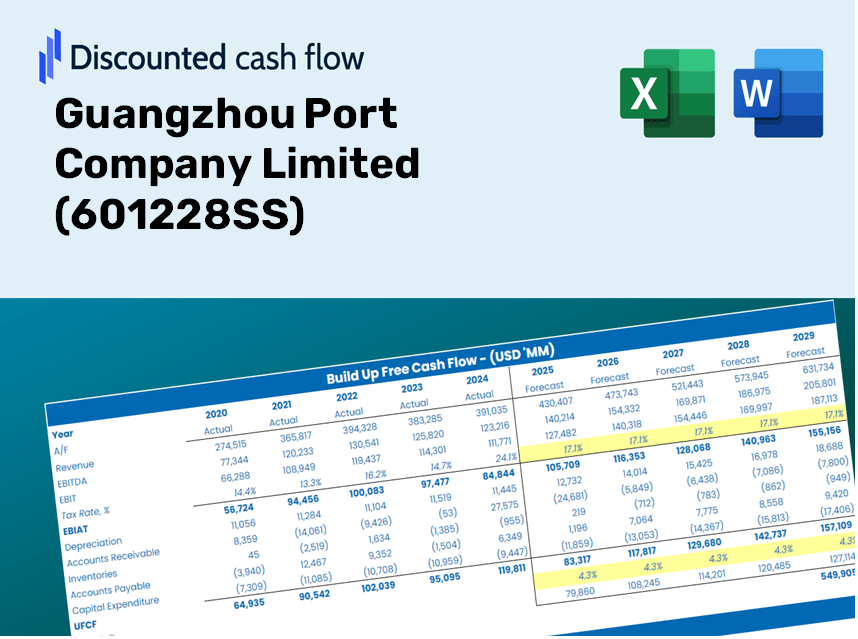
Discounted Cash Flow (DCF) - (USD MM)
| Year | AY1 2020 |
AY2 2021 |
AY3 2022 |
AY4 2023 |
AY5 2024 |
FY1 2025 |
FY2 2026 |
FY3 2027 |
FY4 2028 |
FY5 2029 |
|---|---|---|---|---|---|---|---|---|---|---|
| Revenue | 11,252.8 | 12,020.3 | 12,736.9 | 13,194.0 | 14,072.9 | 14,883.3 | 15,740.3 | 16,646.7 | 17,605.2 | 18,619.0 |
| Revenue Growth, % | 0 | 6.82 | 5.96 | 3.59 | 6.66 | 5.76 | 5.76 | 5.76 | 5.76 | 5.76 |
| EBITDA | 2,589.8 | 2,557.5 | 2,886.2 | 2,801.9 | 3,195.5 | 3,301.0 | 3,491.0 | 3,692.1 | 3,904.7 | 4,129.5 |
| EBITDA, % | 23.02 | 21.28 | 22.66 | 21.24 | 22.71 | 22.18 | 22.18 | 22.18 | 22.18 | 22.18 |
| Depreciation | 1,269.7 | 1,240.8 | 1,354.7 | 1,140.7 | 1,498.8 | 1,534.1 | 1,622.4 | 1,715.9 | 1,814.7 | 1,919.2 |
| Depreciation, % | 11.28 | 10.32 | 10.64 | 8.65 | 10.65 | 10.31 | 10.31 | 10.31 | 10.31 | 10.31 |
| EBIT | 1,320.1 | 1,316.7 | 1,531.5 | 1,661.2 | 1,696.8 | 1,766.9 | 1,868.6 | 1,976.2 | 2,090.0 | 2,210.3 |
| EBIT, % | 11.73 | 10.95 | 12.02 | 12.59 | 12.06 | 11.87 | 11.87 | 11.87 | 11.87 | 11.87 |
| Total Cash | 3,200.6 | 3,875.2 | 7,806.3 | 6,627.3 | 6,118.5 | 6,420.0 | 6,789.7 | 7,180.6 | 7,594.1 | 8,031.4 |
| Total Cash, percent | .0 | .0 | .0 | .0 | .0 | .0 | .0 | .0 | .0 | .0 |
| Account Receivables | 1,110.8 | 854.8 | 1,745.0 | 1,356.9 | 2,400.2 | 1,727.1 | 1,826.6 | 1,931.8 | 2,043.0 | 2,160.7 |
| Account Receivables, % | 9.87 | 7.11 | 13.7 | 10.28 | 17.06 | 11.6 | 11.6 | 11.6 | 11.6 | 11.6 |
| Inventories | 315.3 | 764.6 | 751.8 | 608.7 | 604.2 | 713.6 | 754.6 | 798.1 | 844.0 | 892.7 |
| Inventories, % | 2.8 | 6.36 | 5.9 | 4.61 | 4.29 | 4.79 | 4.79 | 4.79 | 4.79 | 4.79 |
| Accounts Payable | 340.3 | 2,024.6 | 1,936.2 | 1,677.8 | 1,654.9 | 1,772.4 | 1,874.5 | 1,982.4 | 2,096.6 | 2,217.3 |
| Accounts Payable, % | 3.02 | 16.84 | 15.2 | 12.72 | 11.76 | 11.91 | 11.91 | 11.91 | 11.91 | 11.91 |
| Capital Expenditure | -3,766.1 | -4,618.8 | -3,788.1 | -4,348.8 | -3,186.4 | -4,680.4 | -4,949.9 | -5,235.0 | -5,536.4 | -5,855.2 |
| Capital Expenditure, % | -33.47 | -38.42 | -29.74 | -32.96 | -22.64 | -31.45 | -31.45 | -31.45 | -31.45 | -31.45 |
| Tax Rate, % | 40 | 40 | 40 | 40 | 40 | 40 | 40 | 40 | 40 | 40 |
| EBITAT | 834.1 | 929.3 | 1,007.2 | 1,053.9 | 1,018.0 | 1,141.3 | 1,207.0 | 1,276.5 | 1,350.0 | 1,427.7 |
| Depreciation | ||||||||||
| Changes in Account Receivables | ||||||||||
| Changes in Inventories | ||||||||||
| Changes in Accounts Payable | ||||||||||
| Capital Expenditure | ||||||||||
| UFCF | -2,748.1 | -957.8 | -2,392.0 | -1,881.2 | -1,731.4 | -1,323.8 | -2,159.0 | -2,283.3 | -2,414.7 | -2,553.8 |
| WACC, % | 5.54 | 5.64 | 5.58 | 5.55 | 5.5 | 5.56 | 5.56 | 5.56 | 5.56 | 5.56 |
| PV UFCF | ||||||||||
| SUM PV UFCF | -9,025.7 | |||||||||
| Long Term Growth Rate, % | 2.00 | |||||||||
| Free cash flow (T + 1) | -2,605 | |||||||||
| Terminal Value | -73,150 | |||||||||
| Present Terminal Value | -55,808 | |||||||||
| Enterprise Value | -64,834 | |||||||||
| Net Debt | 8,163 | |||||||||
| Equity Value | -72,997 | |||||||||
| Diluted Shares Outstanding, MM | 7,535 | |||||||||
| Equity Value Per Share | -9.69 |
What You Will Receive
- Customizable Excel Template: A user-friendly Excel-based DCF Calculator featuring pre-populated financial data for Guangzhou Port Company Limited (601228SS).
- Authentic Data: Access to historical performance metrics and future projections (highlighted in the yellow cells).
- Flexible Forecasting: Adjust assumptions related to revenue growth, EBITDA percentages, and WACC.
- Instant Calculations: Quickly observe how your inputs influence the valuation of Guangzhou Port Company Limited (601228SS).
- Professional Resource: Designed for investors, CFOs, consultants, and financial analysts.
- Intuitive Layout: Organized for ease of understanding and navigation, complete with step-by-step guidance.
Key Features
- 🔍 Real-Life GZPC Financials: Access pre-filled historical and projected data for Guangzhou Port Company Limited (601228SS).
- ✏️ Fully Customizable Inputs: Modify all essential parameters (highlighted cells) such as WACC, growth %, and tax rates.
- 📊 Professional DCF Valuation: Utilize built-in formulas to calculate the intrinsic value of Guangzhou Port Company Limited (601228SS) using the Discounted Cash Flow method.
- ⚡ Instant Results: View Guangzhou Port's valuation immediately upon making adjustments.
- Scenario Analysis: Explore and compare potential outcomes based on different financial assumptions side-by-side.
How It Functions
- Download: Obtain the pre-prepared Excel file containing financial data for Guangzhou Port Company Limited (601228SS).
- Customize: Modify projections such as revenue growth, EBITDA margin, and WACC as needed.
- Update Automatically: The calculations for intrinsic value and NPV refresh in real-time.
- Test Scenarios: Develop various scenarios and instantly analyze the different results.
- Make Decisions: Leverage the valuation insights to inform your investment approach.
Why Opt for This Calculator?
- Designed for Experts: A sophisticated tool utilized by analysts, CFOs, and consultants.
- Up-to-Date Data: Guangzhou Port Company Limited’s historical and projected financials preloaded for precision.
- Flexible Scenario Analysis: Easily simulate various forecasts and assumptions.
- Comprehensive Outputs: Automatically computes intrinsic value, NPV, and essential metrics.
- User-Friendly Interface: Clear, step-by-step instructions to assist you throughout the process.
Who Can Benefit from This Product?
- Investment Professionals: Develop comprehensive and trustworthy valuation models for port sector investments.
- Corporate Finance Departments: Evaluate valuation scenarios to inform strategic decision-making.
- Consultants and Financial Advisors: Deliver precise valuation insights for Guangzhou Port Company Limited (601228SS) to clients.
- Students and Educators: Utilize real-world data for practicing and teaching financial modeling techniques.
- Port Industry Enthusiasts: Gain insights into how companies like Guangzhou Port Company Limited (601228SS) are valued in the market.
Overview of the Template Components
- Operating and Balance Sheet Data: Pre-filled historical data and forecasts for Guangzhou Port Company Limited (601228SS), including revenue, EBITDA, EBIT, and capital expenditures.
- WACC Calculation: A dedicated sheet for calculating the Weighted Average Cost of Capital (WACC), featuring parameters such as Beta, risk-free rate, and share price.
- DCF Valuation (Unlevered and Levered): Customizable Discounted Cash Flow models showcasing intrinsic value with comprehensive calculations.
- Financial Statements: Pre-loaded annual and quarterly financial statements to facilitate analysis.
- Key Ratios: A set of profitability, leverage, and efficiency ratios specific to Guangzhou Port Company Limited (601228SS).
- Dashboard and Charts: A visual summary of valuation outputs and assumptions for straightforward result analysis.
Disclaimer
All information, articles, and product details provided on this website are for general informational and educational purposes only. We do not claim any ownership over, nor do we intend to infringe upon, any trademarks, copyrights, logos, brand names, or other intellectual property mentioned or depicted on this site. Such intellectual property remains the property of its respective owners, and any references here are made solely for identification or informational purposes, without implying any affiliation, endorsement, or partnership.
We make no representations or warranties, express or implied, regarding the accuracy, completeness, or suitability of any content or products presented. Nothing on this website should be construed as legal, tax, investment, financial, medical, or other professional advice. In addition, no part of this site—including articles or product references—constitutes a solicitation, recommendation, endorsement, advertisement, or offer to buy or sell any securities, franchises, or other financial instruments, particularly in jurisdictions where such activity would be unlawful.
All content is of a general nature and may not address the specific circumstances of any individual or entity. It is not a substitute for professional advice or services. Any actions you take based on the information provided here are strictly at your own risk. You accept full responsibility for any decisions or outcomes arising from your use of this website and agree to release us from any liability in connection with your use of, or reliance upon, the content or products found herein.