
|
Camel Group Co., Ltd. (601311.SS) DCF Valuation |
Fully Editable: Tailor To Your Needs In Excel Or Sheets
Professional Design: Trusted, Industry-Standard Templates
Investor-Approved Valuation Models
MAC/PC Compatible, Fully Unlocked
No Expertise Is Needed; Easy To Follow
Camel Group Co., Ltd. (601311.SS) Bundle
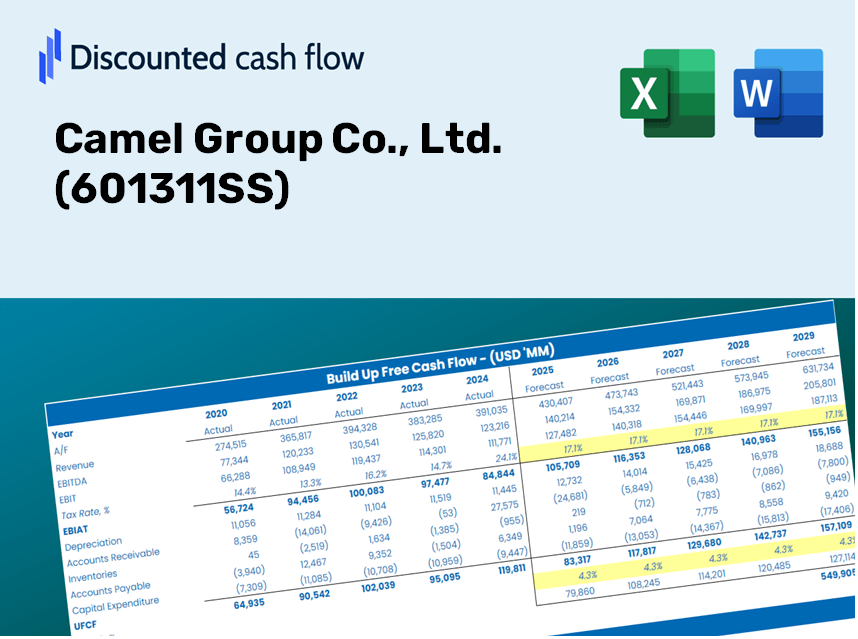
Designed for accuracy, our (601311SS) DCF Calculator enables you to evaluate Camel Group Co., Ltd. valuation using real-time financial data, offering complete flexibility to modify all key parameters for enhanced projections.
Discounted Cash Flow (DCF) - (USD MM)
| Year | AY1 2020 |
AY2 2021 |
AY3 2022 |
AY4 2023 |
AY5 2024 |
FY1 2025 |
FY2 2026 |
FY3 2027 |
FY4 2028 |
FY5 2029 |
|---|---|---|---|---|---|---|---|---|---|---|
| Revenue | 9,639.8 | 12,403.5 | 13,425.4 | 14,078.9 | 15,592.2 | 16,435.3 | 17,324.1 | 18,260.9 | 19,248.3 | 20,289.2 |
| Revenue Growth, % | 0 | 28.67 | 8.24 | 4.87 | 10.75 | 5.41 | 5.41 | 5.41 | 5.41 | 5.41 |
| EBITDA | 1,283.6 | 1,353.1 | 1,043.7 | 1,213.4 | 1,230.3 | 1,594.5 | 1,680.7 | 1,771.6 | 1,867.4 | 1,968.3 |
| EBITDA, % | 13.32 | 10.91 | 7.77 | 8.62 | 7.89 | 9.7 | 9.7 | 9.7 | 9.7 | 9.7 |
| Depreciation | 371.1 | 426.5 | 437.3 | 440.4 | 467.3 | 548.0 | 577.6 | 608.8 | 641.7 | 676.4 |
| Depreciation, % | 3.85 | 3.44 | 3.26 | 3.13 | 3 | 3.33 | 3.33 | 3.33 | 3.33 | 3.33 |
| EBIT | 912.5 | 926.6 | 606.4 | 773.0 | 763.0 | 1,046.5 | 1,103.1 | 1,162.7 | 1,225.6 | 1,291.9 |
| EBIT, % | 9.47 | 7.47 | 4.52 | 5.49 | 4.89 | 6.37 | 6.37 | 6.37 | 6.37 | 6.37 |
| Total Cash | 1,350.1 | 1,907.3 | 1,816.5 | 2,038.2 | 2,250.5 | 2,360.9 | 2,488.6 | 2,623.1 | 2,765.0 | 2,914.5 |
| Total Cash, percent | .0 | .0 | .0 | .0 | .0 | .0 | .0 | .0 | .0 | .0 |
| Account Receivables | 2,254.2 | 2,172.8 | 2,178.3 | 2,485.1 | 2,564.6 | 2,998.6 | 3,160.8 | 3,331.7 | 3,511.9 | 3,701.8 |
| Account Receivables, % | 23.38 | 17.52 | 16.22 | 17.65 | 16.45 | 18.25 | 18.25 | 18.25 | 18.25 | 18.25 |
| Inventories | 1,716.5 | 2,046.9 | 2,388.5 | 2,616.4 | 2,918.5 | 2,938.7 | 3,097.6 | 3,265.1 | 3,441.7 | 3,627.8 |
| Inventories, % | 17.81 | 16.5 | 17.79 | 18.58 | 18.72 | 17.88 | 17.88 | 17.88 | 17.88 | 17.88 |
| Accounts Payable | 46.6 | 149.8 | 227.8 | 814.4 | 527.8 | 412.8 | 435.1 | 458.6 | 483.4 | 509.6 |
| Accounts Payable, % | 0.48375 | 1.21 | 1.7 | 5.78 | 3.39 | 2.51 | 2.51 | 2.51 | 2.51 | 2.51 |
| Capital Expenditure | -224.4 | -253.8 | -267.5 | -290.6 | -284.1 | -337.0 | -355.2 | -374.5 | -394.7 | -416.0 |
| Capital Expenditure, % | -2.33 | -2.05 | -1.99 | -2.06 | -1.82 | -2.05 | -2.05 | -2.05 | -2.05 | -2.05 |
| Tax Rate, % | 11.7 | 11.7 | 11.7 | 11.7 | 11.7 | 11.7 | 11.7 | 11.7 | 11.7 | 11.7 |
| EBITAT | 806.8 | 835.8 | 597.4 | 644.8 | 673.7 | 939.4 | 990.2 | 1,043.8 | 1,100.2 | 1,159.7 |
| Depreciation | ||||||||||
| Changes in Account Receivables | ||||||||||
| Changes in Inventories | ||||||||||
| Changes in Accounts Payable | ||||||||||
| Capital Expenditure | ||||||||||
| UFCF | -2,970.5 | 862.6 | 498.2 | 846.3 | 188.8 | 581.1 | 913.9 | 963.3 | 1,015.4 | 1,070.3 |
| WACC, % | 6.3 | 6.31 | 6.35 | 6.28 | 6.3 | 6.31 | 6.31 | 6.31 | 6.31 | 6.31 |
| PV UFCF | ||||||||||
| SUM PV UFCF | 3,740.5 | |||||||||
| Long Term Growth Rate, % | 3.50 | |||||||||
| Free cash flow (T + 1) | 1,108 | |||||||||
| Terminal Value | 39,480 | |||||||||
| Present Terminal Value | 29,080 | |||||||||
| Enterprise Value | 32,821 | |||||||||
| Net Debt | -262 | |||||||||
| Equity Value | 33,082 | |||||||||
| Diluted Shares Outstanding, MM | 1,173 | |||||||||
| Equity Value Per Share | 28.20 |
What You Will Receive
- Genuine Camel Group Data: Comprehensive financials – from revenue to EBIT – derived from actual and forecasted figures.
- Complete Customization: Modify all key parameters (yellow cells) such as WACC, growth %, and tax rates according to your needs.
- Immediate Valuation Updates: Automatic recalculations to assess the effects of changes on Camel Group's fair value.
- Flexible Excel Template: Designed for quick modifications, scenario testing, and in-depth projections.
- Efficient and Precise: Avoid starting from scratch while ensuring accuracy and adaptability.
Key Features
- Pre-Loaded Data: Camel Group Co., Ltd.'s historical financial statements and pre-filled forecasts.
- Fully Adjustable Inputs: Modify WACC, tax rates, revenue growth, and EBITDA margins as needed.
- Instant Results: Observe real-time recalculations of Camel Group's intrinsic value.
- Clear Visual Outputs: Dashboard charts provide a visual representation of valuation results and key metrics.
- Built for Accuracy: A professional tool designed for analysts, investors, and finance experts.
How It Works
- Step 1: Download the Excel file.
- Step 2: Examine the pre-filled Camel Group Co., Ltd. (601311SS) data (both historical and forecasted).
- Step 3: Modify key assumptions (highlighted in yellow) according to your analysis.
- Step 4: Observe the automatic updates for Camel Group Co., Ltd. (601311SS) intrinsic value.
- Step 5: Utilize the results for investment decisions or reporting purposes.
Why Opt for the Camel Group Calculator?
- Accurate Data: Genuine financial figures from Camel Group Co., Ltd. ensure trustworthy valuation outcomes.
- Customizable: Tailor essential parameters such as growth rates, WACC, and tax rates to align with your forecasts.
- Time-Saving: Pre-configured calculations streamline your process, eliminating the need for starting from scratch.
- Professional-Grade Tool: Created for investors, analysts, and consultants alike.
- User-Friendly: An easy-to-navigate format with step-by-step guidance makes it accessible for users of all levels.
Who Can Benefit from This Product?
- Investors: Evaluate Camel Group Co., Ltd. (601311SS) for informed stock trading decisions.
- CFOs and Financial Analysts: Optimize valuation workflows and assess financial forecasts.
- Startup Founders: Gain insights into the valuation methods of established companies like Camel Group Co., Ltd. (601311SS).
- Consultants: Produce comprehensive valuation reports for clients regarding Camel Group Co., Ltd. (601311SS).
- Students and Educators: Utilize real data from Camel Group Co., Ltd. (601311SS) to practice and teach valuation principles.
Contents of the Template
- Operating and Balance Sheet Data: Pre-filled historical data and forecasts for Camel Group Co., Ltd. (601311SS), including revenue, EBITDA, EBIT, and capital expenditures.
- WACC Calculation: A dedicated sheet for calculating the Weighted Average Cost of Capital (WACC), featuring parameters such as Beta, risk-free rate, and share price.
- DCF Valuation (Unlevered and Levered): Customizable Discounted Cash Flow models that illustrate intrinsic value through comprehensive calculations.
- Financial Statements: Pre-loaded financial statements (annual and quarterly) to facilitate in-depth analysis.
- Key Ratios: A collection of profitability, leverage, and efficiency ratios specific to Camel Group Co., Ltd. (601311SS).
- Dashboard and Charts: Visual summaries of valuation outputs and assumptions for easy result analysis.
Disclaimer
All information, articles, and product details provided on this website are for general informational and educational purposes only. We do not claim any ownership over, nor do we intend to infringe upon, any trademarks, copyrights, logos, brand names, or other intellectual property mentioned or depicted on this site. Such intellectual property remains the property of its respective owners, and any references here are made solely for identification or informational purposes, without implying any affiliation, endorsement, or partnership.
We make no representations or warranties, express or implied, regarding the accuracy, completeness, or suitability of any content or products presented. Nothing on this website should be construed as legal, tax, investment, financial, medical, or other professional advice. In addition, no part of this site—including articles or product references—constitutes a solicitation, recommendation, endorsement, advertisement, or offer to buy or sell any securities, franchises, or other financial instruments, particularly in jurisdictions where such activity would be unlawful.
All content is of a general nature and may not address the specific circumstances of any individual or entity. It is not a substitute for professional advice or services. Any actions you take based on the information provided here are strictly at your own risk. You accept full responsibility for any decisions or outcomes arising from your use of this website and agree to release us from any liability in connection with your use of, or reliance upon, the content or products found herein.