
|
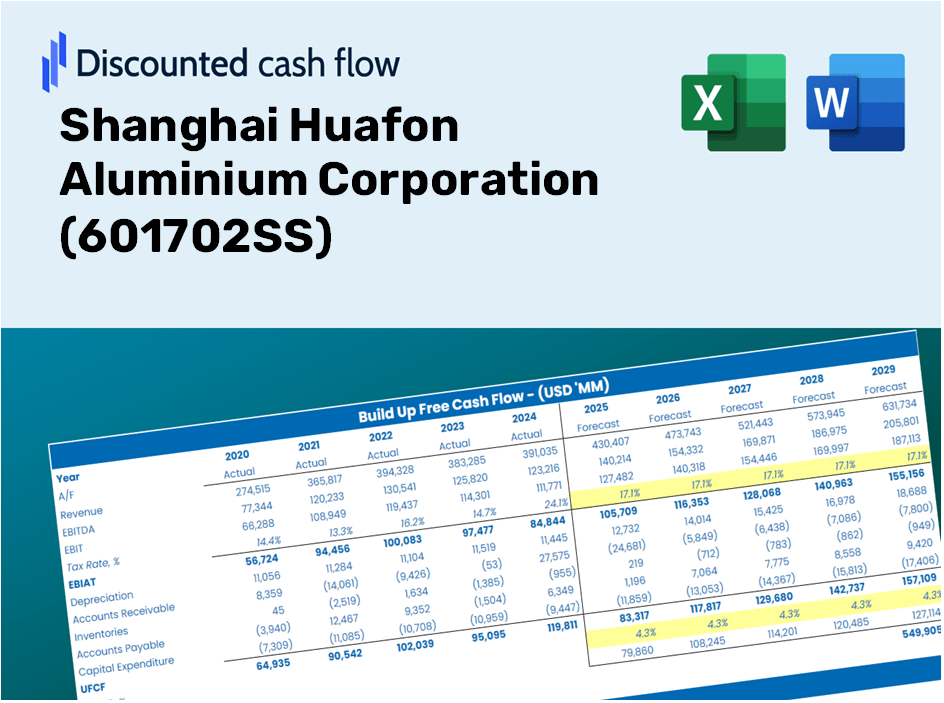
Shanghai Huafon Aluminium Corporation (601702.SS) DCF Valuation |
Fully Editable: Tailor To Your Needs In Excel Or Sheets
Professional Design: Trusted, Industry-Standard Templates
Investor-Approved Valuation Models
MAC/PC Compatible, Fully Unlocked
No Expertise Is Needed; Easy To Follow
Shanghai Huafon Aluminium Corporation (601702.SS) Bundle
Explore the financial potential of Shanghai Huafon Aluminium Corporation (601702SS) with our user-friendly DCF Calculator! Enter your projections for growth, margins, and expenses to calculate the intrinsic value of Shanghai Huafon Aluminium Corporation (601702SS) and inform your investment decisions.
Discounted Cash Flow (DCF) - (USD MM)
| Year | AY1 2020 |
AY2 2021 |
AY3 2022 |
AY4 2023 |
AY5 2024 |
FY1 2025 |
FY2 2026 |
FY3 2027 |
FY4 2028 |
FY5 2029 |
|---|---|---|---|---|---|---|---|---|---|---|
| Revenue | 4,066.9 | 6,448.6 | 8,544.8 | 9,290.9 | 10,878.2 | 14,057.0 | 18,164.6 | 23,472.6 | 30,331.6 | 39,194.9 |
| Revenue Growth, % | 0 | 58.56 | 32.51 | 8.73 | 17.08 | 29.22 | 29.22 | 29.22 | 29.22 | 29.22 |
| EBITDA | 540.1 | 835.6 | 1,016.2 | 1,294.8 | 1,644.6 | 1,888.8 | 2,440.8 | 3,154.0 | 4,075.7 | 5,266.7 |
| EBITDA, % | 13.28 | 12.96 | 11.89 | 13.94 | 15.12 | 13.44 | 13.44 | 13.44 | 13.44 | 13.44 |
| Depreciation | 178.7 | 187.4 | 202.0 | 211.4 | 213.3 | 390.8 | 505.0 | 652.5 | 843.2 | 1,089.6 |
| Depreciation, % | 4.39 | 2.91 | 2.36 | 2.28 | 1.96 | 2.78 | 2.78 | 2.78 | 2.78 | 2.78 |
| EBIT | 361.5 | 648.2 | 814.2 | 1,083.3 | 1,431.3 | 1,498.1 | 1,935.8 | 2,501.5 | 3,232.5 | 4,177.1 |
| EBIT, % | 8.89 | 10.05 | 9.53 | 11.66 | 13.16 | 10.66 | 10.66 | 10.66 | 10.66 | 10.66 |
| Total Cash | 163.3 | 426.0 | 352.0 | 424.2 | 562.8 | 688.2 | 889.4 | 1,149.2 | 1,485.1 | 1,919.0 |
| Total Cash, percent | .0 | .0 | .0 | .0 | .0 | .0 | .0 | .0 | .0 | .0 |
| Account Receivables | 1,333.4 | 1,562.3 | 1,893.1 | 2,717.8 | 2,995.7 | 3,822.4 | 4,939.3 | 6,382.6 | 8,247.7 | 10,657.8 |
| Account Receivables, % | 32.79 | 24.23 | 22.15 | 29.25 | 27.54 | 27.19 | 27.19 | 27.19 | 27.19 | 27.19 |
| Inventories | 1,347.1 | 1,639.7 | 1,939.4 | 2,112.7 | 2,566.3 | 3,586.7 | 4,634.8 | 5,989.2 | 7,739.3 | 10,000.8 |
| Inventories, % | 33.12 | 25.43 | 22.7 | 22.74 | 23.59 | 25.52 | 25.52 | 25.52 | 25.52 | 25.52 |
| Accounts Payable | 218.4 | 257.2 | 124.5 | 219.9 | 761.4 | 567.4 | 733.2 | 947.5 | 1,224.3 | 1,582.1 |
| Accounts Payable, % | 5.37 | 3.99 | 1.46 | 2.37 | 7 | 4.04 | 4.04 | 4.04 | 4.04 | 4.04 |
| Capital Expenditure | -115.5 | -253.6 | -70.7 | -21.3 | -143.9 | -257.3 | -332.5 | -429.7 | -555.3 | -717.5 |
| Capital Expenditure, % | -2.84 | -3.93 | -0.82741 | -0.22946 | -1.32 | -1.83 | -1.83 | -1.83 | -1.83 | -1.83 |
| Tax Rate, % | 11.9 | 11.9 | 11.9 | 11.9 | 11.9 | 11.9 | 11.9 | 11.9 | 11.9 | 11.9 |
| EBITAT | 330.8 | 588.5 | 750.8 | 961.1 | 1,261.0 | 1,352.3 | 1,747.4 | 2,258.0 | 2,917.8 | 3,770.5 |
| Depreciation | ||||||||||
| Changes in Account Receivables | ||||||||||
| Changes in Inventories | ||||||||||
| Changes in Accounts Payable | ||||||||||
| Capital Expenditure | ||||||||||
| UFCF | -2,068.1 | 39.6 | 118.9 | 248.5 | 1,140.4 | -555.4 | -79.4 | -102.6 | -132.6 | -171.3 |
| WACC, % | 6.62 | 6.62 | 6.62 | 6.61 | 6.61 | 6.62 | 6.62 | 6.62 | 6.62 | 6.62 |
| PV UFCF | ||||||||||
| SUM PV UFCF | -902.4 | |||||||||
| Long Term Growth Rate, % | 3.50 | |||||||||
| Free cash flow (T + 1) | -177 | |||||||||
| Terminal Value | -5,691 | |||||||||
| Present Terminal Value | -4,131 | |||||||||
| Enterprise Value | -5,034 | |||||||||
| Net Debt | 522 | |||||||||
| Equity Value | -5,555 | |||||||||
| Diluted Shares Outstanding, MM | 998 | |||||||||
| Equity Value Per Share | -5.56 |
What You Will Receive
- Genuine SH Huafon Financial Data: Pre-loaded with historical and forecast data specific to Shanghai Huafon for accurate analysis.
- Completely Customizable Template: Easily adjust essential inputs such as revenue growth, WACC, and EBITDA percentage.
- Instant Calculations: Watch as the intrinsic value of SH Huafon updates in real-time following your adjustments.
- Professional Valuation Tool: Crafted for investors, analysts, and consultants in search of precise DCF outcomes.
- User-Centric Design: Intuitive layout and straightforward instructions suitable for users of all experience levels.
Key Features
- Authentic SHFA Data: Pre-populated with Shanghai Huafon Aluminium Corporation’s historical financial performance and future projections.
- Completely Customizable Inputs: Modify parameters such as revenue growth, profit margins, WACC, tax rates, and capital expenditures.
- Dynamic Valuation Framework: Automatically refreshes Net Present Value (NPV) and intrinsic value in response to your input adjustments.
- Scenario Analysis: Build various forecasting scenarios to evaluate different potential valuation results.
- Intuitive User Interface: Clear, organized design tailored for both industry professionals and newcomers.
How It Operates
- Step 1: Download the ready-made Excel template featuring Shanghai Huafon Aluminium Corporation's (601702SS) data.
- Step 2: Navigate through the pre-filled sheets to familiarize yourself with the essential metrics.
- Step 3: Adjust forecasts and assumptions in the editable yellow cells (WACC, growth, margins).
- Step 4: View the recalculated results immediately, including the intrinsic value of Shanghai Huafon Aluminium Corporation (601702SS).
- Step 5: Use the outputs to make well-informed investment choices or create detailed reports.
Why Choose the Huafon Aluminium Calculator?
- Save Time: Eliminate the hassle of building a DCF model from scratch – it’s ready to use.
- Enhance Accuracy: Dependable financial data and formulas minimize errors in valuation.
- Completely Customizable: Adjust the model to align with your assumptions and forecasts.
- User-Friendly: Intuitive charts and outputs make the results simple to analyze.
- Favored by Professionals: Crafted for experts who prioritize precision and ease of use.
Who Should Use This Product?
- Professional Investors: Develop comprehensive and accurate valuation models for portfolio assessments related to Shanghai Huafon Aluminium Corporation (601702SS).
- Corporate Finance Teams: Examine valuation scenarios to inform strategic decisions within their organizations.
- Consultants and Advisors: Deliver precise valuation insights for clients interested in investing in Shanghai Huafon Aluminium Corporation (601702SS).
- Students and Educators: Utilize real-world data to enhance learning and practice in financial modeling.
- Industry Analysts: Gain a deeper understanding of how companies like Shanghai Huafon Aluminium Corporation (601702SS) are valued in the market.
Contents of the Template
- Pre-Filled Data: Contains Shanghai Huafon Aluminium Corporation's historical financial performance and forecasts.
- Discounted Cash Flow Model: An editable DCF valuation model featuring automatic calculations.
- Weighted Average Cost of Capital (WACC): A dedicated worksheet for calculating WACC based on user-defined inputs.
- Key Financial Ratios: Assess profitability, efficiency, and financial leverage for Shanghai Huafon Aluminium Corporation (601702SS).
- Customizable Inputs: Easily modify revenue growth rates, profit margins, and tax rates.
- Clear Dashboard: Visual representations including charts and tables that highlight essential valuation results.
Disclaimer
All information, articles, and product details provided on this website are for general informational and educational purposes only. We do not claim any ownership over, nor do we intend to infringe upon, any trademarks, copyrights, logos, brand names, or other intellectual property mentioned or depicted on this site. Such intellectual property remains the property of its respective owners, and any references here are made solely for identification or informational purposes, without implying any affiliation, endorsement, or partnership.
We make no representations or warranties, express or implied, regarding the accuracy, completeness, or suitability of any content or products presented. Nothing on this website should be construed as legal, tax, investment, financial, medical, or other professional advice. In addition, no part of this site—including articles or product references—constitutes a solicitation, recommendation, endorsement, advertisement, or offer to buy or sell any securities, franchises, or other financial instruments, particularly in jurisdictions where such activity would be unlawful.
All content is of a general nature and may not address the specific circumstances of any individual or entity. It is not a substitute for professional advice or services. Any actions you take based on the information provided here are strictly at your own risk. You accept full responsibility for any decisions or outcomes arising from your use of this website and agree to release us from any liability in connection with your use of, or reliance upon, the content or products found herein.