
|
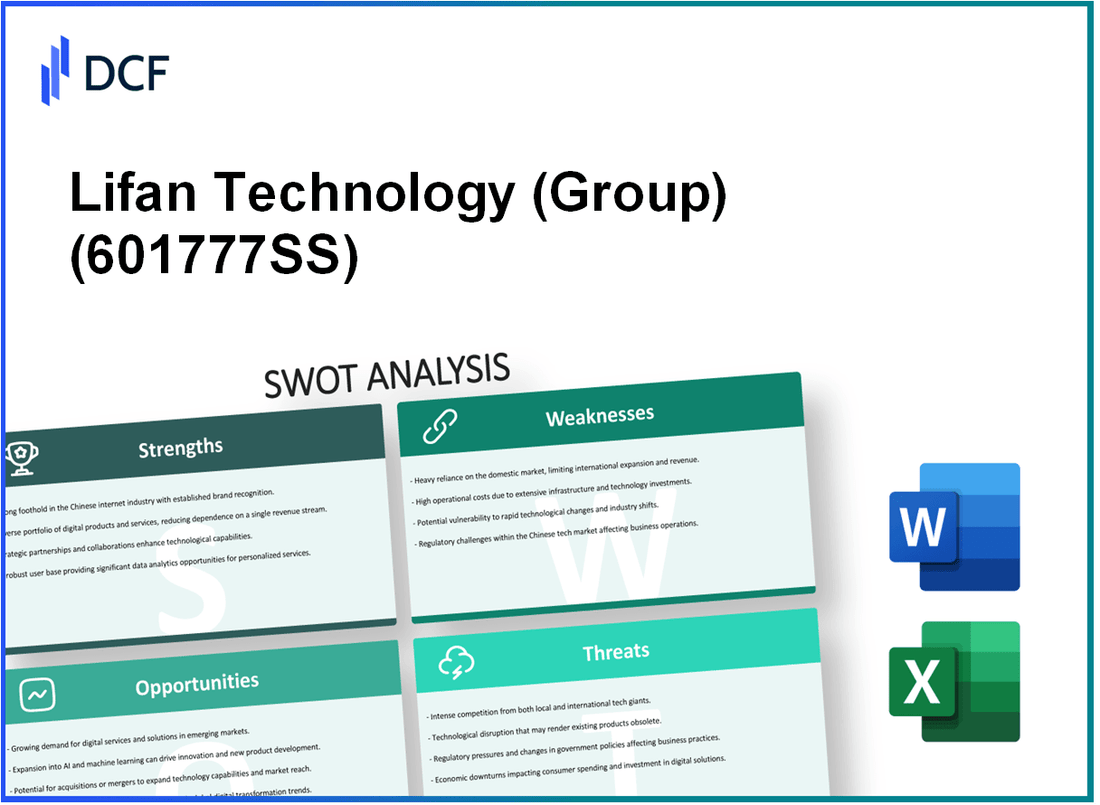
Lifan Technology Co., Ltd. (601777.SS): SWOT Analysis |
Fully Editable: Tailor To Your Needs In Excel Or Sheets
Professional Design: Trusted, Industry-Standard Templates
Investor-Approved Valuation Models
MAC/PC Compatible, Fully Unlocked
No Expertise Is Needed; Easy To Follow
Lifan Technology (Group) Co., Ltd. (601777.SS) Bundle
In the fast-paced world of automotive innovation, Lifan Technology (Group) Co., Ltd. stands at a crossroads where strengths, weaknesses, opportunities, and threats shape its path forward. From an established brand and diverse product lineup to facing fierce competition and market challenges, understanding Lifan's SWOT analysis reveals not just the current landscape but hints at future possibilities in the burgeoning electric vehicle sector and beyond. Dive deeper to uncover how Lifan can navigate its strategic journey in this dynamic industry.
Lifan Technology (Group) Co., Ltd. - SWOT Analysis: Strengths
Lifan Technology (Group) Co., Ltd. has a robust standing in the automotive and motorcycle industry, characterized by several strengths that enhance its market position.
Established Brand Recognition in the Automotive and Motorcycle Segments
Lifan has established a strong brand presence both domestically in China and in various international markets. According to industry reports, Lifan ranked among the top ten motorcycle manufacturers in China in terms of sales volume, with approximately 1.5 million units sold in 2022. This brand recognition contributes to a loyal customer base and facilitates market penetration.
Diverse Product Portfolio, Including Electric Vehicles and Traditional Models
The company offers a wide array of products, ranging from traditional gasoline vehicles to newer electric models. As of 2023, Lifan introduced several electric vehicles (EVs), capturing approximately 8% of the local EV market share. The company's lineup includes over 30 different models in both the motorcycle and automotive segments, which caters to varying consumer preferences and market demands.
Strong Research and Development Capabilities for Innovation
Lifan invests heavily in research and development, with a reported expenditure of around $50 million annually. The company's R&D department has been pivotal in developing advanced technology for vehicles, including fuel efficiency and sustainability features. Notably, Lifan has developed proprietary technology focusing on hybrid vehicles, playing a key role in its drive towards innovation.
Extensive Distribution Network in Domestic and International Markets
Lifan boasts a comprehensive distribution network that spans both domestic and international markets. As of 2023, the company has over 1,000 dealerships in China and has expanded to approximately 50 countries worldwide. This network enhances Lifan’s ability to reach a broad customer base and respond quickly to market demands.
| Strength | Details | Statistical Data |
|---|---|---|
| Brand Recognition | Top ten motorcycle manufacturer in China | 1.5 million units sold in 2022 |
| Product Portfolio | Diverse range including EVs and traditional models | 8% market share in local EV market; 30+ models |
| R&D Capabilities | Significant investment in innovation | $50 million annual R&D budget |
| Distribution Network | Extensive dealership presence | 1,000+ dealerships in China; distributes to 50+ countries |
Lifan Technology (Group) Co., Ltd. - SWOT Analysis: Weaknesses
Limited market presence in highly competitive Western markets: Lifan Technology has struggled to establish a strong foothold in Western markets, primarily due to the competitive landscape dominated by established brands such as Ford, General Motors, and Volkswagen. In 2022, Lifan's market share in the U.S. automotive sector was approximately 0.1%, significantly lower than its competitors.
Dependence on the Chinese market for a significant portion of revenue: Lifan Technology's revenue is heavily reliant on the domestic Chinese market. In 2021, the company reported that over 80% of its total revenue, approximately RMB 12 billion (around $1.9 billion), was generated from China. Such dependence on a single market exposes the company to regional economic downturns and fluctuations in consumer demand.
Vulnerability to fluctuations in raw material prices impacting production costs: Raw material costs have a direct effect on Lifan's production expenses. For instance, in 2022, the prices of aluminum and steel surged by over 25% and 35%, respectively, compared to the previous year. This increase in costs has led to tighter margins, as Lifan's profit margin decreased from 7% in 2021 to 4.5% in 2022.
| Material | Price Increase 2022 (%) | Impact on Cost of Goods Sold (COGS) |
|---|---|---|
| Aluminum | 25% | Increased by approximately RMB 500 million ($77 million) |
| Steel | 35% | Increased by approximately RMB 800 million ($123 million) |
Challenges in maintaining consistent quality across different product lines: Lifan has faced issues regarding product quality, particularly in its motorcycle and automobile segments. Consumer reports have indicated that around 15% of Lifan's vehicles have experienced quality complaints within the first year of purchase. This has impacted brand reputation and customer loyalty. In 2022, the company invested approximately RMB 200 million (about $31 million) to enhance quality control measures.
Lifan Technology (Group) Co., Ltd. - SWOT Analysis: Opportunities
The global shift towards electric vehicles (EVs) presents a significant opportunity for Lifan Technology. According to the International Energy Agency (IEA), the number of electric cars on the road reached over 16 million in 2020, a 43% increase from 2019. This trend is expected to continue, with projections indicating that by 2030, there could be as many as 145 million EVs worldwide. Lifan, with its established automotive manufacturing background, can capitalize on this growth.
Moreover, the expansions in the EV market open doors for collaboration. Strategic alliances with companies like battery manufacturers or tech firms focused on EV technology can facilitate market entry. Lifan's partnerships could reflect the industry trend of collaboration; for instance, in 2022, Tesla and Panasonic announced plans to expand their battery production partnership, highlighting the value of partnerships in the EV sector.
Environmental considerations are driving consumer behavior towards sustainable transportation solutions. Research by McKinsey indicates that 70% of consumers are willing to pay more for sustainable products. Lifan could align its product offerings with this demand, potentially enhancing its brand reputation and market share. In 2021, the global electric vehicle market was valued at approximately $250 billion and is projected to grow at a compound annual growth rate (CAGR) of 22.6% from 2022 to 2030.
Technological advancements in vehicle connectivity and autonomous driving represent further opportunities for Lifan. The global connected car market was valued at around $63 billion in 2021 and is expected to reach $225 billion by 2026, growing at a CAGR of 29.5%. Investments in connected technologies can help Lifan innovate and remain competitive in a rapidly evolving automotive landscape.
| Opportunity | Current Market Value | Projected Growth Rate | Key Players |
|---|---|---|---|
| Electric Vehicles | $250 billion (2021) | 22.6% CAGR (2022-2030) | Tesla, BYD, NIO |
| Connected Cars | $63 billion (2021) | 29.5% CAGR (2021-2026) | Ford, General Motors, BMW |
| Battery Technology | $18 billion (2022) | 16.5% CAGR (2022-2030) | CATL, LG Chem, Panasonic |
As the automotive industry evolves, Lifan Technology (Group) Co., Ltd. stands at a crossroads, with numerous avenues for growth and expansion. The convergence of electric vehicle demand, strategic partnerships, sustainability trends, and technological innovations sets a robust framework for the company's future developments.
Lifan Technology (Group) Co., Ltd. - SWOT Analysis: Threats
One of the primary threats to Lifan Technology is the intense competition from established global automotive manufacturers. Companies like Volkswagen, Toyota, and General Motors dominate the market with strong brand loyalty and advanced technologies. For instance, in 2022, Toyota sold approximately 10.5 million vehicles, while Volkswagen followed with around 8.3 million vehicles. These manufacturers benefit from economies of scale and extensive research and development budgets, which can exceed $10 billion annually for major players.
Additionally, Lifan faces risks from potential regulatory changes impacting production and sales, especially regarding emissions standards. The European Union's stringent regulations aim for a 55% reduction in emissions by 2030 compared to 1990 levels. Non-compliance can lead to significant penalties, estimated at up to €30,000 per violation. Similar regulations in China, including the China VI emission standards, require substantial investments in technology to meet the requirements, which could strain Lifan's financial resources.
Economic instability and trade tensions are further threats to Lifan's operations. The ongoing trade war between the United States and China has resulted in tariffs exceeding 25% on various automotive parts, leading to increased costs. The International Monetary Fund (IMF) projected global economic growth at only 3.2% in 2022, indicating a sluggish environment for automotive sales. In 2021, China's GDP growth slowed to 8.1%, further impacting consumer spending on vehicles.
Rapid technological advancements by competitors also put pressure on Lifan's innovation cycle. For example, Tesla’s market capitalization has soared to approximately $800 billion, fueled by their advancements in electric vehicle (EV) technology. As of 2022, Tesla's production capacity reached 1 million vehicles annually, thanks in part to significant investments in new battery technologies and production methods. Lifan, which has been slower to adopt EV technologies, risks falling behind if it does not accelerate its innovation efforts.
| Threat | Description | Impact | Financial Data |
|---|---|---|---|
| Intense Competition | Established global manufacturers dominate the market. | High | Toyota: 10.5 million vehicles sold (2022) |
| Regulatory Changes | Stricter emissions regulations in key markets. | Medium | EU penalties up to €30,000 per violation |
| Economic Instability | Trade tensions and slow economic growth affect sales. | High | IMF projects global growth at 3.2% (2022) |
| Technological Advancements | Competitors advancing rapidly in EV technology. | High | Tesla: Market cap of $800 billion, 1 million vehicles produced (2022) |
The SWOT analysis of Lifan Technology (Group) Co., Ltd. reveals a company with significant strengths and ample opportunities for growth, particularly in the electric vehicle sector; however, it must navigate notable weaknesses and external threats to bolster its competitive position in a rapidly evolving automotive landscape.
Disclaimer
All information, articles, and product details provided on this website are for general informational and educational purposes only. We do not claim any ownership over, nor do we intend to infringe upon, any trademarks, copyrights, logos, brand names, or other intellectual property mentioned or depicted on this site. Such intellectual property remains the property of its respective owners, and any references here are made solely for identification or informational purposes, without implying any affiliation, endorsement, or partnership.
We make no representations or warranties, express or implied, regarding the accuracy, completeness, or suitability of any content or products presented. Nothing on this website should be construed as legal, tax, investment, financial, medical, or other professional advice. In addition, no part of this site—including articles or product references—constitutes a solicitation, recommendation, endorsement, advertisement, or offer to buy or sell any securities, franchises, or other financial instruments, particularly in jurisdictions where such activity would be unlawful.
All content is of a general nature and may not address the specific circumstances of any individual or entity. It is not a substitute for professional advice or services. Any actions you take based on the information provided here are strictly at your own risk. You accept full responsibility for any decisions or outcomes arising from your use of this website and agree to release us from any liability in connection with your use of, or reliance upon, the content or products found herein.