
|
China Coal Xinji Energy Co.,Ltd (601918.SS) DCF Valuation |
Fully Editable: Tailor To Your Needs In Excel Or Sheets
Professional Design: Trusted, Industry-Standard Templates
Investor-Approved Valuation Models
MAC/PC Compatible, Fully Unlocked
No Expertise Is Needed; Easy To Follow
China Coal Xinji Energy Co.,Ltd (601918.SS) Bundle
Whether you're an investor or an analyst, this (601918SS) DCF Calculator is your go-to resource for accurate valuation. Featuring real data from China Coal Xinji Energy Co., Ltd, you can adjust forecasts and instantly observe the effects.
What You Will Receive
- Customizable Excel Template: A fully adjustable Excel-based DCF Calculator featuring pre-filled financial data for China Coal Xinji Energy Co., Ltd (601918SS).
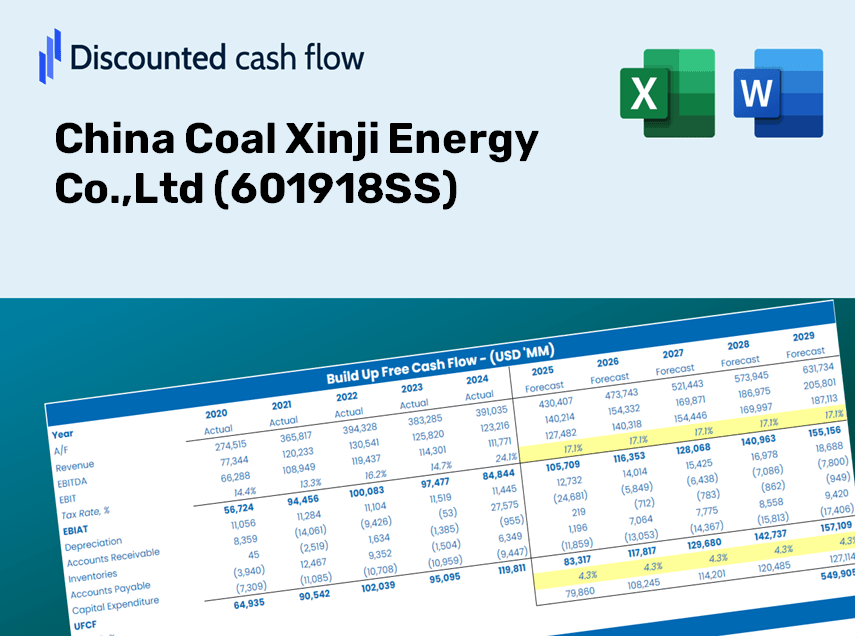
- Comprehensive Data: Access to historical figures and forward-looking projections (highlighted in the yellow cells).
- Flexible Forecasting: Modify key assumptions such as revenue growth, EBITDA margins, and WACC.
- Instant Calculations: Quickly visualize how your inputs affect the valuation of China Coal Xinji Energy Co., Ltd (601918SS).
- Professional Software: Designed for use by investors, CFOs, consultants, and financial analysts.
- Intuitive Interface: Organized for simplicity and ease of navigation, complete with step-by-step guidance.
Key Features
- Customizable Forecast Inputs: Adjust essential parameters such as revenue growth, EBITDA percentage, and capital expenditure projections.
- Instant DCF Valuation: Quickly computes intrinsic value, net present value (NPV), and additional financial metrics.
- High-Precision Estimations: Leverages China Coal Xinji Energy Co., Ltd.'s (601918SS) actual financial data for accurate valuation results.
- Simplified Scenario Analysis: Easily explore various assumptions and evaluate their effects on outcomes.
- Efficiency Boost: Avoid the challenges of crafting intricate valuation models from the ground up.
How It Functions
- Step 1: Download the Excel file for China Coal Xinji Energy Co., Ltd (601918SS).
- Step 2: Examine the pre-filled financial data and projections for the company.
- Step 3: Adjust key inputs such as revenue growth, WACC, and tax rates (cells highlighted for your convenience).
- Step 4: Observe the DCF model refresh in real-time as you modify your assumptions.
- Step 5: Evaluate the results and leverage the insights for your investment choices.
Why Choose This Calculator for China Coal Xinji Energy Co., Ltd (601918SS)?
- Precision: Utilizes accurate financial data pertaining to China Coal Xinji Energy Co., Ltd (601918SS) for reliable results.
- Adaptability: Built for users to easily experiment with and adjust inputs as needed.
- Efficiency: Avoid the complications of creating a DCF model from the ground up.
- Expert-Level: Crafted with the expertise and usability that aligns with CFO standards.
- Intuitive: Simple to navigate, even for those with limited experience in financial modeling.
Who Would Benefit from This Product?
- Investors: Assess the valuation of China Coal Xinji Energy Co., Ltd (601918SS) before making trading decisions.
- CFOs and Financial Analysts: Enhance valuation methodologies and validate financial forecasts.
- Startup Founders: Understand how large public entities like China Coal Xinji Energy Co., Ltd (601918SS) are appraised.
- Consultants: Provide comprehensive valuation reports for clients regarding China Coal Xinji Energy Co., Ltd (601918SS).
- Students and Educators: Utilize real-time data to practice and instruct valuation strategies.
Contents of the Template
- Operating and Balance Sheet Data: Pre-filled historical data and forecasts for China Coal Xinji Energy Co., Ltd (601918SS), including revenue, EBITDA, EBIT, and capital expenditures.
- WACC Calculation: A dedicated sheet for the Weighted Average Cost of Capital (WACC), featuring parameters such as Beta, risk-free rate, and share price.
- DCF Valuation (Unlevered and Levered): Customizable Discounted Cash Flow models that demonstrate intrinsic value along with comprehensive calculations.
- Financial Statements: Pre-loaded annual and quarterly financial statements to assist in thorough analysis.
- Key Ratios: A collection of profitability, leverage, and efficiency ratios specific to China Coal Xinji Energy Co., Ltd (601918SS).
- Dashboard and Charts: Visual representations of valuation outputs and assumptions for straightforward result analysis.
Disclaimer
All information, articles, and product details provided on this website are for general informational and educational purposes only. We do not claim any ownership over, nor do we intend to infringe upon, any trademarks, copyrights, logos, brand names, or other intellectual property mentioned or depicted on this site. Such intellectual property remains the property of its respective owners, and any references here are made solely for identification or informational purposes, without implying any affiliation, endorsement, or partnership.
We make no representations or warranties, express or implied, regarding the accuracy, completeness, or suitability of any content or products presented. Nothing on this website should be construed as legal, tax, investment, financial, medical, or other professional advice. In addition, no part of this site—including articles or product references—constitutes a solicitation, recommendation, endorsement, advertisement, or offer to buy or sell any securities, franchises, or other financial instruments, particularly in jurisdictions where such activity would be unlawful.
All content is of a general nature and may not address the specific circumstances of any individual or entity. It is not a substitute for professional advice or services. Any actions you take based on the information provided here are strictly at your own risk. You accept full responsibility for any decisions or outcomes arising from your use of this website and agree to release us from any liability in connection with your use of, or reliance upon, the content or products found herein.