
|
Shenzhen Hopewind Electric Co., Ltd. (603063.SS) DCF Valuation |
Fully Editable: Tailor To Your Needs In Excel Or Sheets
Professional Design: Trusted, Industry-Standard Templates
Investor-Approved Valuation Models
MAC/PC Compatible, Fully Unlocked
No Expertise Is Needed; Easy To Follow
Shenzhen Hopewind Electric Co., Ltd. (603063.SS) Bundle
Discover the true potential of Shenzhen Hopewind Electric Co., Ltd. (603063SS) with our advanced DCF Calculator! Adjust key assumptions, explore various scenarios, and assess how different factors influence the valuation of Shenzhen Hopewind Electric Co., Ltd. (603063SS) – all within a single Excel template.
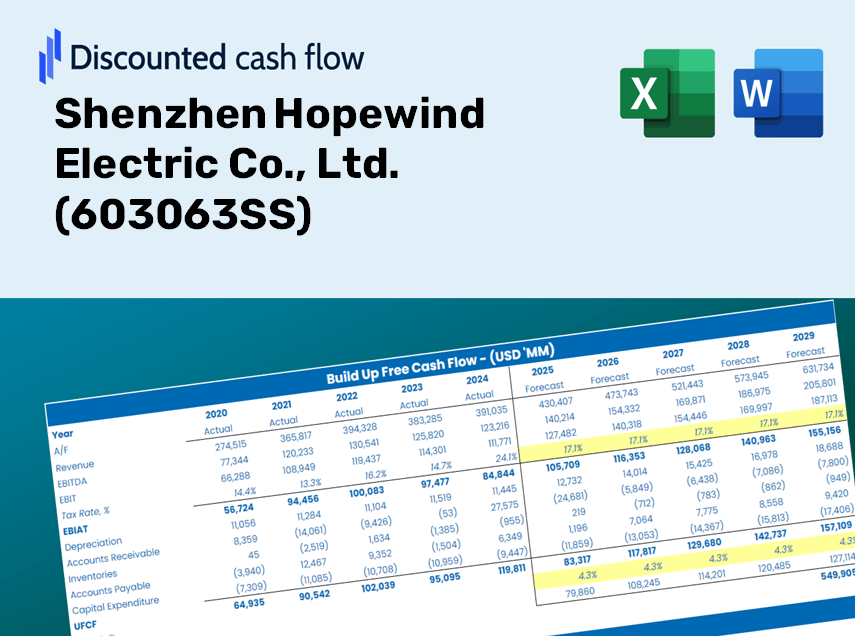
Discounted Cash Flow (DCF) - (USD MM)
| Year | AY1 2020 |
AY2 2021 |
AY3 2022 |
AY4 2023 |
AY5 2024 |
FY1 2025 |
FY2 2026 |
FY3 2027 |
FY4 2028 |
FY5 2029 |
|---|---|---|---|---|---|---|---|---|---|---|
| Revenue | 2,338.5 | 2,103.9 | 2,809.1 | 3,752.0 | 3,733.3 | 4,261.1 | 4,863.6 | 5,551.2 | 6,336.1 | 7,231.9 |
| Revenue Growth, % | 0 | -10.03 | 33.52 | 33.56 | -0.49926 | 14.14 | 14.14 | 14.14 | 14.14 | 14.14 |
| EBITDA | 318.4 | 298.2 | 333.5 | 686.7 | 607.2 | 632.6 | 722.0 | 824.1 | 940.6 | 1,073.6 |
| EBITDA, % | 13.62 | 14.17 | 11.87 | 18.3 | 16.26 | 14.84 | 14.84 | 14.84 | 14.84 | 14.84 |
| Depreciation | 18.7 | 30.5 | 59.0 | 160.7 | 92.5 | 94.7 | 108.0 | 123.3 | 140.7 | 160.6 |
| Depreciation, % | 0.79754 | 1.45 | 2.1 | 4.28 | 2.48 | 2.22 | 2.22 | 2.22 | 2.22 | 2.22 |
| EBIT | 299.8 | 267.6 | 274.5 | 526.0 | 514.7 | 537.9 | 614.0 | 700.8 | 799.8 | 912.9 |
| EBIT, % | 12.82 | 12.72 | 9.77 | 14.02 | 13.79 | 12.62 | 12.62 | 12.62 | 12.62 | 12.62 |
| Total Cash | 762.1 | 749.4 | 954.2 | 1,474.2 | 1,758.7 | 1,607.1 | 1,834.3 | 2,093.7 | 2,389.7 | 2,727.5 |
| Total Cash, percent | .0 | .0 | .0 | .0 | .0 | .0 | .0 | .0 | .0 | .0 |
| Account Receivables | 1,829.6 | 1,793.1 | 1,980.2 | 2,426.2 | 2,839.1 | 3,193.0 | 3,644.4 | 4,159.7 | 4,747.8 | 5,419.0 |
| Account Receivables, % | 78.24 | 85.23 | 70.49 | 64.66 | 76.05 | 74.93 | 74.93 | 74.93 | 74.93 | 74.93 |
| Inventories | 721.1 | 854.2 | 1,101.1 | 892.6 | 817.6 | 1,332.2 | 1,520.6 | 1,735.6 | 1,981.0 | 2,261.1 |
| Inventories, % | 30.83 | 40.6 | 39.2 | 23.79 | 21.9 | 31.27 | 31.27 | 31.27 | 31.27 | 31.27 |
| Accounts Payable | 1,106.5 | 1,317.7 | 1,551.6 | 1,683.3 | 1,795.2 | 2,199.9 | 2,510.9 | 2,865.9 | 3,271.1 | 3,733.6 |
| Accounts Payable, % | 47.32 | 62.63 | 55.23 | 44.86 | 48.09 | 51.63 | 51.63 | 51.63 | 51.63 | 51.63 |
| Capital Expenditure | -296.0 | -522.8 | -263.8 | -422.5 | -101.7 | -518.9 | -592.2 | -676.0 | -771.5 | -880.6 |
| Capital Expenditure, % | -12.66 | -24.85 | -9.39 | -11.26 | -2.72 | -12.18 | -12.18 | -12.18 | -12.18 | -12.18 |
| Tax Rate, % | 15.47 | 15.47 | 15.47 | 15.47 | 15.47 | 15.47 | 15.47 | 15.47 | 15.47 | 15.47 |
| EBITAT | 280.1 | 257.4 | 247.4 | 463.6 | 435.1 | 486.7 | 555.5 | 634.1 | 723.7 | 826.0 |
| Depreciation | ||||||||||
| Changes in Account Receivables | ||||||||||
| Changes in Inventories | ||||||||||
| Changes in Accounts Payable | ||||||||||
| Capital Expenditure | ||||||||||
| UFCF | -1,441.4 | -120.3 | -157.6 | 96.0 | 199.8 | -401.3 | -257.4 | -293.8 | -335.4 | -382.8 |
| WACC, % | 5.36 | 5.36 | 5.35 | 5.34 | 5.33 | 5.35 | 5.35 | 5.35 | 5.35 | 5.35 |
| PV UFCF | ||||||||||
| SUM PV UFCF | -1,431.6 | |||||||||
| Long Term Growth Rate, % | 4.00 | |||||||||
| Free cash flow (T + 1) | -398 | |||||||||
| Terminal Value | -29,568 | |||||||||
| Present Terminal Value | -22,789 | |||||||||
| Enterprise Value | -24,220 | |||||||||
| Net Debt | -689 | |||||||||
| Equity Value | -23,532 | |||||||||
| Diluted Shares Outstanding, MM | 441 | |||||||||
| Equity Value Per Share | -53.41 |
What You Will Receive
- Authentic Shenzhen Hopewind Data: Preloaded financials – including revenue and EBIT – derived from actual and projected metrics.
- Comprehensive Customization: Modify all essential parameters (yellow cells) such as WACC, growth %, and tax rates.
- Real-Time Valuation Updates: Automatic recalculations to assess the effects of changes on Shenzhen Hopewind's fair value.
- Adaptable Excel Template: Designed for quick modifications, scenario analysis, and thorough projections.
- Efficient and Reliable: Avoid the hassle of constructing models from the ground up while ensuring accuracy and flexibility.
Key Features
- Pre-Loaded Data: Shenzhen Hopewind Electric Co., Ltd.'s historical financial statements and pre-filled forecasts.
- Fully Adjustable Inputs: Customize WACC, tax rates, revenue growth, and EBITDA margins as needed.
- Instant Results: Watch the intrinsic value of Shenzhen Hopewind Electric Co., Ltd. (603063SS) recalculate in real time.
- Clear Visual Outputs: Interactive dashboard charts showcase valuation results and important metrics.
- Built for Accuracy: A professional-grade tool designed for analysts, investors, and financial professionals.
How It Works
- Step 1: Download the Excel file for Shenzhen Hopewind Electric Co., Ltd. (603063SS).
- Step 2: Examine the pre-populated financial data and forecasts for Hopewind.
- Step 3: Adjust key parameters such as revenue growth, WACC, and tax rates (highlighted cells).
- Step 4: Observe the DCF model refresh in real-time as you modify the inputs.
- Step 5: Evaluate the results and leverage the outputs for your investment strategy.
Why Opt for This Calculator?
- Reliable Data: Utilize authentic financial information from Shenzhen Hopewind Electric Co., Ltd. ([603063SS]) for trustworthy valuation outcomes.
- Customizable Features: Modify essential parameters such as growth rates, WACC, and tax rates to align with your forecasts.
- Time-Efficient: With pre-configured calculations, you can skip the initial groundwork.
- Professional-Grade Resource: Tailored for investors, analysts, and consultants in the industry.
- User-Friendly Design: The intuitive interface and guided instructions make it accessible for all users.
Who Can Benefit from Shenzhen Hopewind Electric Co., Ltd. (603063SS)?
- Investors: Make informed choices with a robust valuation tool tailored for the energy sector.
- Financial Analysts: Expedite your analysis with a customizable DCF model designed for efficiency.
- Consultants: Seamlessly modify the template for client reports or presentations in the renewable energy field.
- Energy Sector Enthusiasts: Enhance your knowledge of valuation methodologies with practical, industry-specific examples.
- Educators and Students: Utilize this tool as a hands-on resource in energy finance courses.
Contents of the Template
- Preloaded Hopewind Data: Historical and projected financial metrics, including revenue, EBIT, and capital expenditures.
- DCF and WACC Models: Advanced sheets for assessing intrinsic value and calculating the Weighted Average Cost of Capital.
- Editable Inputs: Cells highlighted in yellow for customizing revenue growth, tax rates, and discount rates.
- Financial Statements: Detailed annual and quarterly financial reports for in-depth analysis.
- Key Ratios: Metrics on profitability, leverage, and efficiency to assess performance.
- Dashboard and Charts: Visual representations of valuation results and underlying assumptions.
Disclaimer
All information, articles, and product details provided on this website are for general informational and educational purposes only. We do not claim any ownership over, nor do we intend to infringe upon, any trademarks, copyrights, logos, brand names, or other intellectual property mentioned or depicted on this site. Such intellectual property remains the property of its respective owners, and any references here are made solely for identification or informational purposes, without implying any affiliation, endorsement, or partnership.
We make no representations or warranties, express or implied, regarding the accuracy, completeness, or suitability of any content or products presented. Nothing on this website should be construed as legal, tax, investment, financial, medical, or other professional advice. In addition, no part of this site—including articles or product references—constitutes a solicitation, recommendation, endorsement, advertisement, or offer to buy or sell any securities, franchises, or other financial instruments, particularly in jurisdictions where such activity would be unlawful.
All content is of a general nature and may not address the specific circumstances of any individual or entity. It is not a substitute for professional advice or services. Any actions you take based on the information provided here are strictly at your own risk. You accept full responsibility for any decisions or outcomes arising from your use of this website and agree to release us from any liability in connection with your use of, or reliance upon, the content or products found herein.