
|
Gan & Lee Pharmaceuticals. (603087.SS) DCF Valuation |
Fully Editable: Tailor To Your Needs In Excel Or Sheets
Professional Design: Trusted, Industry-Standard Templates
Investor-Approved Valuation Models
MAC/PC Compatible, Fully Unlocked
No Expertise Is Needed; Easy To Follow
Gan & Lee Pharmaceuticals. (603087.SS) Bundle
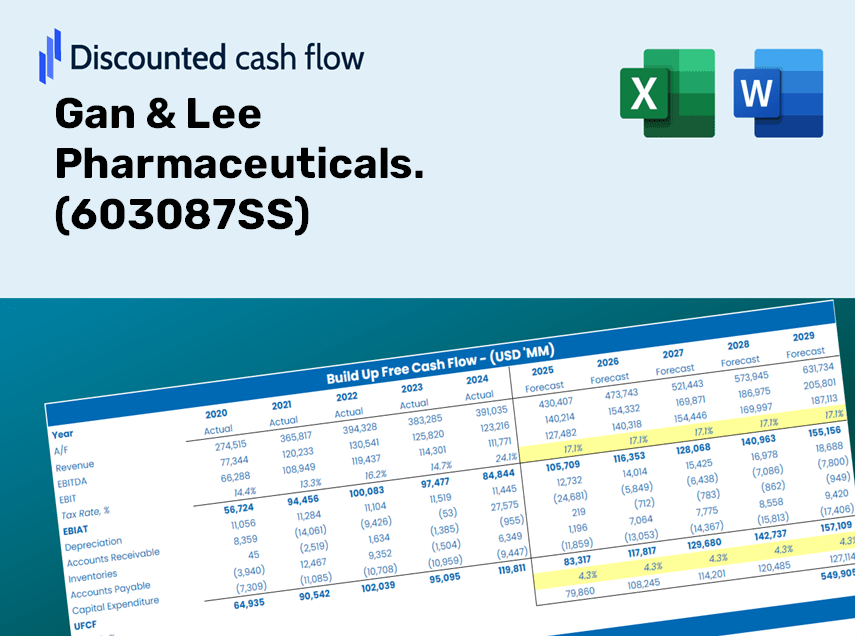
Designed for accuracy, our (603087SS) DCF Calculator enables you to evaluate Gan & Lee Pharmaceuticals' valuation using real-world financial data and offers complete flexibility to modify all key parameters for enhanced projections.
Discounted Cash Flow (DCF) - (USD MM)
| Year | AY1 2020 |
AY2 2021 |
AY3 2022 |
AY4 2023 |
AY5 2024 |
FY1 2025 |
FY2 2026 |
FY3 2027 |
FY4 2028 |
FY5 2029 |
|---|---|---|---|---|---|---|---|---|---|---|
| Revenue | 3,361.9 | 3,612.0 | 1,712.3 | 2,608.0 | 3,045.3 | 3,227.5 | 3,420.6 | 3,625.2 | 3,842.1 | 4,071.9 |
| Revenue Growth, % | 0 | 7.44 | -52.6 | 52.31 | 16.77 | 5.98 | 5.98 | 5.98 | 5.98 | 5.98 |
| EBITDA | 1,574.4 | 1,570.9 | -479.9 | 400.8 | 545.6 | 617.0 | 653.9 | 693.0 | 734.4 | 778.4 |
| EBITDA, % | 46.83 | 43.49 | -28.03 | 15.37 | 17.91 | 19.12 | 19.12 | 19.12 | 19.12 | 19.12 |
| Depreciation | 159.6 | 180.6 | 195.8 | 220.8 | 251.0 | 244.6 | 259.2 | 274.7 | 291.2 | 308.6 |
| Depreciation, % | 4.75 | 5 | 11.44 | 8.46 | 8.24 | 7.58 | 7.58 | 7.58 | 7.58 | 7.58 |
| EBIT | 1,414.8 | 1,390.2 | -675.7 | 180.0 | 294.6 | 372.4 | 394.7 | 418.3 | 443.3 | 469.8 |
| EBIT, % | 42.08 | 38.49 | -39.46 | 6.9 | 9.67 | 11.54 | 11.54 | 11.54 | 11.54 | 11.54 |
| Total Cash | 3,611.9 | 4,929.9 | 4,526.2 | 4,853.1 | 2,403.3 | 3,091.4 | 3,276.4 | 3,472.3 | 3,680.1 | 3,900.2 |
| Total Cash, percent | .0 | .0 | .0 | .0 | .0 | .0 | .0 | .0 | .0 | .0 |
| Account Receivables | 832.3 | 941.2 | 195.5 | 388.9 | 248.6 | 550.6 | 583.6 | 618.5 | 655.5 | 694.7 |
| Account Receivables, % | 24.76 | 26.06 | 11.42 | 14.91 | 8.16 | 17.06 | 17.06 | 17.06 | 17.06 | 17.06 |
| Inventories | 493.5 | 651.3 | 648.6 | 860.5 | 1,052.9 | 891.8 | 945.2 | 1,001.7 | 1,061.7 | 1,125.2 |
| Inventories, % | 14.68 | 18.03 | 37.88 | 32.99 | 34.57 | 27.63 | 27.63 | 27.63 | 27.63 | 27.63 |
| Accounts Payable | 17.8 | 37.7 | 44.7 | 105.5 | 129.1 | 80.5 | 85.3 | 90.4 | 95.8 | 101.6 |
| Accounts Payable, % | 0.52988 | 1.04 | 2.61 | 4.05 | 4.24 | 2.49 | 2.49 | 2.49 | 2.49 | 2.49 |
| Capital Expenditure | -582.1 | -692.1 | -983.4 | -553.1 | -440.8 | -836.5 | -886.6 | -939.6 | -995.8 | -1,055.4 |
| Capital Expenditure, % | -17.32 | -19.16 | -57.44 | -21.21 | -14.47 | -25.92 | -25.92 | -25.92 | -25.92 | -25.92 |
| Tax Rate, % | 2.49 | 2.49 | 2.49 | 2.49 | 2.49 | 2.49 | 2.49 | 2.49 | 2.49 | 2.49 |
| EBITAT | 1,204.6 | 1,190.8 | -509.8 | 200.0 | 287.2 | 330.5 | 350.3 | 371.2 | 393.4 | 417.0 |
| Depreciation | ||||||||||
| Changes in Account Receivables | ||||||||||
| Changes in Inventories | ||||||||||
| Changes in Accounts Payable | ||||||||||
| Capital Expenditure | ||||||||||
| UFCF | -525.9 | 432.7 | -542.2 | -476.7 | 68.9 | -451.1 | -358.6 | -380.0 | -402.7 | -426.8 |
| WACC, % | 11.28 | 11.28 | 11.28 | 11.28 | 11.28 | 11.28 | 11.28 | 11.28 | 11.28 | 11.28 |
| PV UFCF | ||||||||||
| SUM PV UFCF | -1,483.4 | |||||||||
| Long Term Growth Rate, % | 2.00 | |||||||||
| Free cash flow (T + 1) | -435 | |||||||||
| Terminal Value | -4,691 | |||||||||
| Present Terminal Value | -2,749 | |||||||||
| Enterprise Value | -4,232 | |||||||||
| Net Debt | -899 | |||||||||
| Equity Value | -3,333 | |||||||||
| Diluted Shares Outstanding, MM | 591 | |||||||||
| Equity Value Per Share | -5.64 |
What You Will Receive
- Comprehensive Financial Model: Leverage Gan & Lee Pharmaceuticals’ actual data for accurate DCF valuation.
- Complete Forecasting Control: Modify revenue growth, profit margins, WACC, and other essential parameters.
- Real-Time Calculations: Automatic updates provide immediate insights as you make adjustments.
- Professional-Grade Template: A polished Excel file crafted for high-quality valuation presentations.
- Flexible and Reusable: Designed for adaptability, enabling repeated use for in-depth forecasting.
Key Features
- Genuine Gan & Lee Financials: Gain access to precise pre-loaded historical data along with future forecasts.
- Tailorable Forecast Parameters: Modify the highlighted cells for WACC, growth rates, and profit margins.
- Real-Time Calculations: Automatic updates for DCF, Net Present Value (NPV), and cash flow assessments.
- Interactive Dashboard: User-friendly charts and summaries to effectively present your valuation findings.
- Designed for All Levels: An easy-to-navigate layout ideal for investors, CFOs, and consultants alike.
How It Operates
- Download: Obtain the pre-configured Excel file featuring Gan & Lee Pharmaceuticals' financial data.
- Customize: Modify projections such as revenue growth, EBITDA %, and WACC to fit your analysis.
- Update Automatically: Watch as the intrinsic value and NPV calculations refresh in real-time.
- Test Scenarios: Develop various forecasts and instantly evaluate the different outcomes.
- Make Decisions: Leverage the valuation results to inform your investment approach.
Why Choose Gan & Lee Pharmaceuticals Calculator?
- All-in-One Solution: Offers DCF, WACC, and comprehensive financial ratio analytics in a single platform.
- Flexible Input Options: Modify the highlighted fields to explore different financial scenarios.
- In-Depth Analysis: Automatically determines the intrinsic value and Net Present Value for Gan & Lee Pharmaceuticals.
- Built-in Information: Historical and projected data provide reliable foundational figures.
- Expert-Level Tool: Perfect for financial analysts, investors, and business consultants focused on Gan & Lee Pharmaceuticals (603087SS).
Who Can Benefit from This Product?
- Individual Investors: Make well-informed decisions regarding the purchase or sale of Gan & Lee Pharmaceuticals (603087SS) stock.
- Financial Analysts: Enhance valuation procedures with accessible and efficient financial models tailored for Gan & Lee Pharmaceuticals (603087SS).
- Consultants: Provide clients with precise and timely valuation insights related to Gan & Lee Pharmaceuticals (603087SS).
- Business Owners: Gain an understanding of how large pharmaceutical companies like Gan & Lee Pharmaceuticals (603087SS) are valued to inform your own business strategies.
- Finance Students: Explore valuation techniques using real data and case studies from Gan & Lee Pharmaceuticals (603087SS).
What the Template Contains
- Operating and Balance Sheet Data: Pre-filled historical data and forecasts for Gan & Lee Pharmaceuticals (603087SS), including revenue, EBITDA, EBIT, and capital expenditures.
- WACC Calculation: A dedicated sheet for calculating the Weighted Average Cost of Capital (WACC), featuring parameters such as Beta, risk-free rate, and share price.
- DCF Valuation (Unlevered and Levered): Customizable Discounted Cash Flow models that display the intrinsic value with comprehensive calculations.
- Financial Statements: Pre-loaded annual and quarterly financial statements to facilitate thorough analysis.
- Key Ratios: Includes important profitability, leverage, and efficiency ratios for Gan & Lee Pharmaceuticals (603087SS).
- Dashboard and Charts: Visual summary of valuation outputs and assumptions, allowing for straightforward analysis of results.
Disclaimer
All information, articles, and product details provided on this website are for general informational and educational purposes only. We do not claim any ownership over, nor do we intend to infringe upon, any trademarks, copyrights, logos, brand names, or other intellectual property mentioned or depicted on this site. Such intellectual property remains the property of its respective owners, and any references here are made solely for identification or informational purposes, without implying any affiliation, endorsement, or partnership.
We make no representations or warranties, express or implied, regarding the accuracy, completeness, or suitability of any content or products presented. Nothing on this website should be construed as legal, tax, investment, financial, medical, or other professional advice. In addition, no part of this site—including articles or product references—constitutes a solicitation, recommendation, endorsement, advertisement, or offer to buy or sell any securities, franchises, or other financial instruments, particularly in jurisdictions where such activity would be unlawful.
All content is of a general nature and may not address the specific circumstances of any individual or entity. It is not a substitute for professional advice or services. Any actions you take based on the information provided here are strictly at your own risk. You accept full responsibility for any decisions or outcomes arising from your use of this website and agree to release us from any liability in connection with your use of, or reliance upon, the content or products found herein.