
|
Hengdian Entertainment Co.,LTD (603103.SS) DCF Valuation |
Fully Editable: Tailor To Your Needs In Excel Or Sheets
Professional Design: Trusted, Industry-Standard Templates
Investor-Approved Valuation Models
MAC/PC Compatible, Fully Unlocked
No Expertise Is Needed; Easy To Follow
Hengdian Entertainment Co.,LTD (603103.SS) Bundle
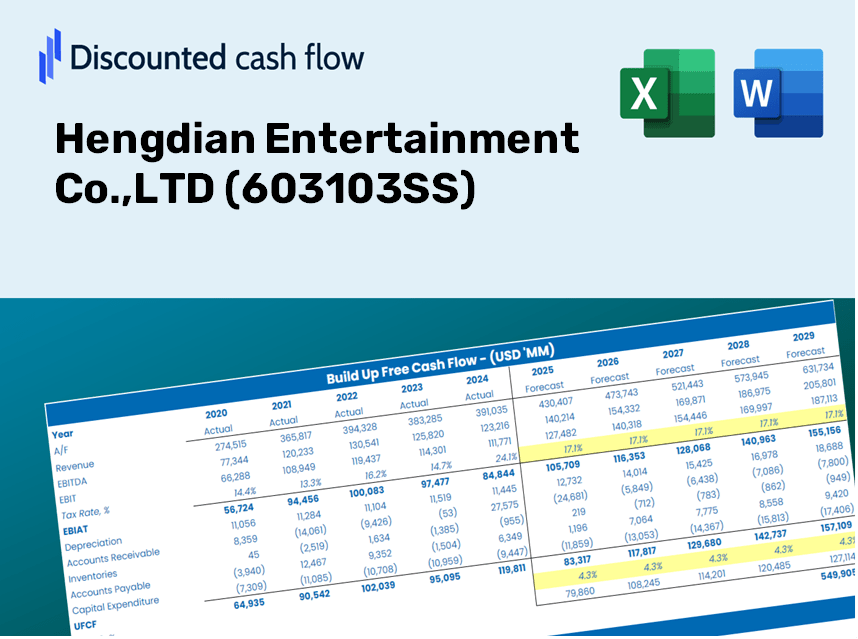
Discover the true potential of Hengdian Entertainment Co.,LTD (603103SS) with our advanced DCF Calculator! Adjust key assumptions, explore various scenarios, and assess how changes affect Hengdian's valuation – all within one convenient Excel template.
Discounted Cash Flow (DCF) - (USD MM)
| Year | AY1 2020 |
AY2 2021 |
AY3 2022 |
AY4 2023 |
AY5 2024 |
FY1 2025 |
FY2 2026 |
FY3 2027 |
FY4 2028 |
FY5 2029 |
|---|---|---|---|---|---|---|---|---|---|---|
| Revenue | 989.7 | 2,283.5 | 1,426.8 | 2,348.9 | 1,971.5 | 2,518.8 | 3,218.0 | 4,111.3 | 5,252.6 | 6,710.7 |
| Revenue Growth, % | 0 | 130.72 | -37.51 | 64.62 | -16.07 | 27.76 | 27.76 | 27.76 | 27.76 | 27.76 |
| EBITDA | -328.9 | 274.4 | -114.7 | 349.4 | 52.1 | -59.1 | -75.5 | -96.4 | -123.2 | -157.4 |
| EBITDA, % | -33.23 | 12.02 | -8.04 | 14.88 | 2.64 | -2.35 | -2.35 | -2.35 | -2.35 | -2.35 |
| Depreciation | 189.4 | 178.9 | 177.0 | 167.3 | 157.0 | 274.4 | 350.5 | 447.8 | 572.1 | 731.0 |
| Depreciation, % | 19.14 | 7.83 | 12.41 | 7.12 | 7.96 | 10.89 | 10.89 | 10.89 | 10.89 | 10.89 |
| EBIT | -518.3 | 95.6 | -291.7 | 182.1 | -104.9 | -333.4 | -426.0 | -544.3 | -695.3 | -888.4 |
| EBIT, % | -52.37 | 4.19 | -20.45 | 7.75 | -5.32 | -13.24 | -13.24 | -13.24 | -13.24 | -13.24 |
| Total Cash | 1,081.6 | 711.2 | 637.9 | 904.1 | 855.9 | 1,298.5 | 1,658.9 | 2,119.4 | 2,707.8 | 3,459.4 |
| Total Cash, percent | .0 | .0 | .0 | .0 | .0 | .0 | .0 | .0 | .0 | .0 |
| Account Receivables | 292.0 | 116.2 | 80.4 | 94.6 | 198.7 | 273.7 | 349.7 | 446.7 | 570.8 | 729.2 |
| Account Receivables, % | 29.5 | 5.09 | 5.64 | 4.03 | 10.08 | 10.87 | 10.87 | 10.87 | 10.87 | 10.87 |
| Inventories | 110.0 | 206.2 | 105.1 | 73.1 | 91.4 | 177.6 | 226.9 | 289.9 | 370.4 | 473.3 |
| Inventories, % | 11.12 | 9.03 | 7.37 | 3.11 | 4.64 | 7.05 | 7.05 | 7.05 | 7.05 | 7.05 |
| Accounts Payable | 239.7 | 223.9 | 297.2 | 296.9 | 240.9 | 401.6 | 513.1 | 655.5 | 837.4 | 1,069.9 |
| Accounts Payable, % | 24.22 | 9.81 | 20.83 | 12.64 | 12.22 | 15.94 | 15.94 | 15.94 | 15.94 | 15.94 |
| Capital Expenditure | -220.2 | -356.7 | -202.0 | -202.7 | -223.2 | -362.6 | -463.3 | -591.9 | -756.2 | -966.1 |
| Capital Expenditure, % | -22.25 | -15.62 | -14.16 | -8.63 | -11.32 | -14.4 | -14.4 | -14.4 | -14.4 | -14.4 |
| Tax Rate, % | -13.11 | -13.11 | -13.11 | -13.11 | -13.11 | -13.11 | -13.11 | -13.11 | -13.11 | -13.11 |
| EBITAT | -486.7 | 44.2 | -291.9 | 170.8 | -118.6 | -289.4 | -369.7 | -472.4 | -603.5 | -771.0 |
| Depreciation | ||||||||||
| Changes in Account Receivables | ||||||||||
| Changes in Inventories | ||||||||||
| Changes in Accounts Payable | ||||||||||
| Capital Expenditure | ||||||||||
| UFCF | -679.8 | -69.9 | -106.7 | 153.0 | -363.2 | -378.2 | -496.3 | -634.0 | -810.1 | -1,034.9 |
| WACC, % | 7.52 | 7.12 | 7.58 | 7.52 | 7.58 | 7.46 | 7.46 | 7.46 | 7.46 | 7.46 |
| PV UFCF | ||||||||||
| SUM PV UFCF | -2,622.0 | |||||||||
| Long Term Growth Rate, % | 3.90 | |||||||||
| Free cash flow (T + 1) | -1,075 | |||||||||
| Terminal Value | -30,171 | |||||||||
| Present Terminal Value | -21,051 | |||||||||
| Enterprise Value | -23,673 | |||||||||
| Net Debt | 683 | |||||||||
| Equity Value | -24,356 | |||||||||
| Diluted Shares Outstanding, MM | 643 | |||||||||
| Equity Value Per Share | -37.91 |
Benefits You Will Receive
- Flexible Forecast Inputs: Effortlessly adjust key parameters (growth %, margins, WACC) to explore various scenarios.
- Industry-Specific Data: Hengdian Entertainment's financials pre-populated to kickstart your evaluation.
- Instant DCF Calculations: The template automatically computes Net Present Value (NPV) and intrinsic value for your convenience.
- Tailored and Professional Design: A sleek Excel model that conforms to your valuation requirements.
- Designed for Analysts and Investors: Perfect for assessing forecasts, verifying strategies, and enhancing efficiency.
Key Features
- Accurate Financial Data for Hengdian Entertainment: Gain access to reliable historical and future financial projections tailored for [603103SS].
- Customizable Assumptions: Adjust key inputs like discount rates, growth rates, and profit margins in the highlighted sections.
- Real-Time Calculations: Experience automatic refreshes for DCF, Net Present Value (NPV), and cash flow assessments.
- User-Friendly Dashboard: Utilize visually appealing charts and summaries to easily interpret your valuation findings.
- Designed for All Skill Levels: A straightforward, intuitive layout catering to investors, CFOs, and consultants alike.
How It Functions
- Download the Template: Gain immediate access to the Excel-based Hengdian Entertainment DCF Calculator.
- Input Your Assumptions: Modify the yellow-highlighted cells for growth rates, WACC, profit margins, and other variables.
- Instant Results: The model automatically recalculates Hengdian Entertainment's intrinsic value.
- Test Different Scenarios: Experiment with various assumptions to assess potential changes in valuation.
- Analyze and Make Decisions: Utilize the findings to inform your investment or financial strategies.
Reasons to Choose Hengdian Entertainment Co., Ltd (603103SS)
- Precision: Utilizes real financial data for accurate insights.
- Adaptability: Built for users to effortlessly adjust and test various parameters.
- Efficiency: Eliminate the complexities of constructing a financial model from the ground up.
- Expert-Quality: Crafted with the same level of diligence as top finance professionals.
- User-Centric: Intuitive design ensures accessibility for those with limited financial modeling skills.
Who Can Benefit from Hengdian Entertainment Co.,LTD (603103SS)?
- Investors: Gain insights and make informed choices with our comprehensive valuation tool.
- Financial Analysts: Enhance your workflow with a customizable DCF model designed for efficiency.
- Consultants: Seamlessly personalize the template for impactful client reports and presentations.
- Finance Enthusiasts: Expand your knowledge of valuation strategies through practical, real-world case studies.
- Educators and Students: Utilize this resource as a hands-on learning aid in finance courses.
Contents of the Template
- Pre-Filled Data: Contains Hengdian Entertainment Co., LTD’s historical financial data and forecasts.
- Discounted Cash Flow Model: An editable DCF valuation model that performs automatic calculations.
- Weighted Average Cost of Capital (WACC): A specific sheet for calculating WACC using customized inputs.
- Key Financial Ratios: Assess Hengdian's profitability, efficiency, and financial leverage.
- Customizable Inputs: Easily modify revenue growth rates, profit margins, and tax rates.
- Clear Dashboard: Visual representations such as charts and tables that summarize key valuation outcomes.
Disclaimer
All information, articles, and product details provided on this website are for general informational and educational purposes only. We do not claim any ownership over, nor do we intend to infringe upon, any trademarks, copyrights, logos, brand names, or other intellectual property mentioned or depicted on this site. Such intellectual property remains the property of its respective owners, and any references here are made solely for identification or informational purposes, without implying any affiliation, endorsement, or partnership.
We make no representations or warranties, express or implied, regarding the accuracy, completeness, or suitability of any content or products presented. Nothing on this website should be construed as legal, tax, investment, financial, medical, or other professional advice. In addition, no part of this site—including articles or product references—constitutes a solicitation, recommendation, endorsement, advertisement, or offer to buy or sell any securities, franchises, or other financial instruments, particularly in jurisdictions where such activity would be unlawful.
All content is of a general nature and may not address the specific circumstances of any individual or entity. It is not a substitute for professional advice or services. Any actions you take based on the information provided here are strictly at your own risk. You accept full responsibility for any decisions or outcomes arising from your use of this website and agree to release us from any liability in connection with your use of, or reliance upon, the content or products found herein.