
|
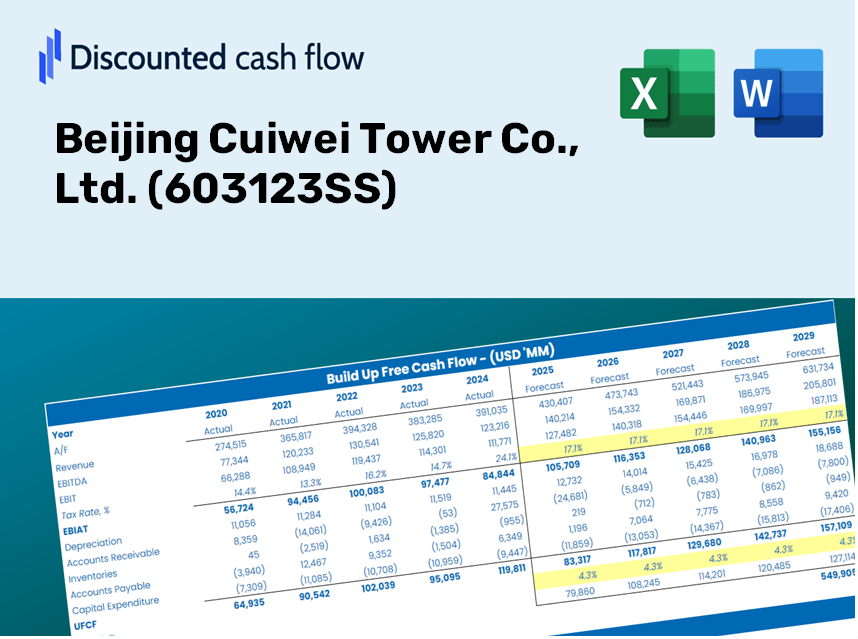
Beijing Cuiwei Tower Co., Ltd. (603123.SS) DCF Valuation |
Fully Editable: Tailor To Your Needs In Excel Or Sheets
Professional Design: Trusted, Industry-Standard Templates
Investor-Approved Valuation Models
MAC/PC Compatible, Fully Unlocked
No Expertise Is Needed; Easy To Follow
Beijing Cuiwei Tower Co., Ltd. (603123.SS) Bundle
Explore the financial outlook of Beijing Cuiwei Tower Co., Ltd. (603123SS) with our user-friendly DCF Calculator! Enter your projections for growth, margins, and expenses to determine the intrinsic value of Beijing Cuiwei Tower Co., Ltd. (603123SS) and inform your investment decisions.
Discounted Cash Flow (DCF) - (USD MM)
| Year | AY1 2020 |
AY2 2021 |
AY3 2022 |
AY4 2023 |
AY5 2024 |
FY1 2025 |
FY2 2026 |
FY3 2027 |
FY4 2028 |
FY5 2029 |
|---|---|---|---|---|---|---|---|---|---|---|
| Revenue | 4,092.9 | 3,497.3 | 3,966.5 | 3,660.3 | 2,228.9 | 1,961.7 | 1,726.5 | 1,519.5 | 1,337.3 | 1,176.9 |
| Revenue Growth, % | 0 | -14.55 | 13.41 | -7.72 | -39.11 | -11.99 | -11.99 | -11.99 | -11.99 | -11.99 |
| EBITDA | 234.9 | 299.9 | 197.6 | 48.4 | -441.8 | 3.1 | 2.7 | 2.4 | 2.1 | 1.9 |
| EBITDA, % | 5.74 | 8.58 | 4.98 | 1.32 | -19.82 | 0.15895 | 0.15895 | 0.15895 | 0.15895 | 0.15895 |
| Depreciation | 139.6 | 142.0 | 148.1 | 139.9 | 114.7 | 79.1 | 69.7 | 61.3 | 54.0 | 47.5 |
| Depreciation, % | 3.41 | 4.06 | 3.73 | 3.82 | 5.15 | 4.03 | 4.03 | 4.03 | 4.03 | 4.03 |
| EBIT | 95.3 | 158.0 | 49.4 | -91.5 | -556.6 | -76.0 | -66.9 | -58.9 | -51.8 | -45.6 |
| EBIT, % | 2.33 | 4.52 | 1.25 | -2.5 | -24.97 | -3.88 | -3.88 | -3.88 | -3.88 | -3.88 |
| Total Cash | 2,665.5 | 2,700.7 | 2,224.4 | 1,875.8 | 2,032.8 | 1,337.4 | 1,177.0 | 1,035.9 | 911.7 | 802.4 |
| Total Cash, percent | .0 | .0 | .0 | .0 | .0 | .0 | .0 | .0 | .0 | .0 |
| Account Receivables | 89.7 | 99.3 | 162.1 | 99.2 | 68.4 | 58.5 | 51.5 | 45.3 | 39.9 | 35.1 |
| Account Receivables, % | 2.19 | 2.84 | 4.09 | 2.71 | 3.07 | 2.98 | 2.98 | 2.98 | 2.98 | 2.98 |
| Inventories | 288.1 | 242.5 | 189.2 | 93.7 | 106.1 | 102.2 | 90.0 | 79.2 | 69.7 | 61.3 |
| Inventories, % | 7.04 | 6.93 | 4.77 | 2.56 | 4.76 | 5.21 | 5.21 | 5.21 | 5.21 | 5.21 |
| Accounts Payable | 306.7 | 367.4 | 385.7 | 192.8 | 150.5 | 155.9 | 137.2 | 120.8 | 106.3 | 93.6 |
| Accounts Payable, % | 7.49 | 10.51 | 9.72 | 5.27 | 6.75 | 7.95 | 7.95 | 7.95 | 7.95 | 7.95 |
| Capital Expenditure | -66.7 | -380.2 | -149.8 | -95.1 | -41.9 | -81.4 | -71.7 | -63.1 | -55.5 | -48.8 |
| Capital Expenditure, % | -1.63 | -10.87 | -3.78 | -2.6 | -1.88 | -4.15 | -4.15 | -4.15 | -4.15 | -4.15 |
| Tax Rate, % | -7.09 | -7.09 | -7.09 | -7.09 | -7.09 | -7.09 | -7.09 | -7.09 | -7.09 | -7.09 |
| EBITAT | 31.8 | 145.9 | 46.0 | -94.6 | -596.0 | -63.7 | -56.1 | -49.3 | -43.4 | -38.2 |
| Depreciation | ||||||||||
| Changes in Account Receivables | ||||||||||
| Changes in Inventories | ||||||||||
| Changes in Accounts Payable | ||||||||||
| Capital Expenditure | ||||||||||
| UFCF | 33.6 | 4.5 | 53.2 | -84.3 | -547.1 | -46.7 | -57.5 | -50.6 | -44.5 | -39.2 |
| WACC, % | 3.82 | 4.35 | 4.36 | 4.42 | 4.42 | 4.27 | 4.27 | 4.27 | 4.27 | 4.27 |
| PV UFCF | ||||||||||
| SUM PV UFCF | -211.8 | |||||||||
| Long Term Growth Rate, % | 2.00 | |||||||||
| Free cash flow (T + 1) | -40 | |||||||||
| Terminal Value | -1,760 | |||||||||
| Present Terminal Value | -1,428 | |||||||||
| Enterprise Value | -1,639 | |||||||||
| Net Debt | 544 | |||||||||
| Equity Value | -2,184 | |||||||||
| Diluted Shares Outstanding, MM | 755 | |||||||||
| Equity Value Per Share | -2.89 |
What You Will Receive
- Authentic CWT Financial Data: Pre-loaded with historical and projected figures for meticulous analysis.
- Completely Customizable Template: Easily adjust essential inputs such as revenue growth, WACC, and EBITDA percentage.
- Instantaneous Calculations: Watch CWT’s intrinsic value reflect your modifications in real time.
- Expert Valuation Tool: Tailored for investors, analysts, and consultants in pursuit of reliable DCF outcomes.
- Intuitive User Interface: Streamlined layout and straightforward instructions suitable for users of all expertise levels.
Key Features
- Comprehensive Historical Data: Access Beijing Cuiwei Tower Co., Ltd.'s (603123SS) past financial reports and detailed projections.
- Customizable Variables: Modify WACC, tax rates, revenue growth, and EBITDA margins to fit your analysis.
- Real-Time Insights: Watch the intrinsic value of Beijing Cuiwei Tower Co., Ltd. (603123SS) update instantly.
- Intuitive Visualizations: Interactive dashboard charts present valuation results and essential metrics clearly.
- Designed for Precision: A sophisticated tool tailored for analysts, investors, and finance professionals.
How It Functions
- Download the Template: Gain immediate access to the Excel-based Beijing Cuiwei Tower Co., Ltd. (603123SS) DCF Calculator.
- Input Your Assumptions: Modify the yellow-highlighted cells for growth rates, WACC, margins, and other variables.
- Instant Calculations: The model automatically recalculates the intrinsic value of Beijing Cuiwei Tower Co., Ltd. (603123SS).
- Test Scenarios: Experiment with various assumptions to assess potential changes in valuation.
- Analyze and Decide: Utilize the outcomes to inform your investment decisions or financial evaluations.
Why Choose Beijing Cuiwei Tower Co., Ltd. (603123SS) Calculator?
- Save Time: Skip the hassle of building a DCF model from scratch – it’s fully prepared for your needs.
- Enhance Accuracy: Dependable financial data and calculations help minimize valuation errors.
- Completely Customizable: Adapt the model to suit your assumptions and forecasts.
- User-Friendly: Intuitive charts and outputs make analyzing results straightforward.
- Endorsed by Professionals: Built for those who prioritize accuracy and ease of use.
Who Can Benefit from Our Services?
- Investors: Make informed choices with our enterprise-level valuation tools tailored for [603123SS].
- Financial Analysts: Streamline your workflow with our customizable pre-built DCF model specific to [603123SS].
- Consultants: Effortlessly modify our template for impactful client presentations and reports featuring [603123SS].
- Finance Enthusiasts: Enhance your knowledge of valuation methods through real-world applications related to [603123SS].
- Educators and Students: Utilize our resources as a hands-on learning aid in finance courses focused on [603123SS].
Contents of the Template
- Pre-Filled Data: Contains Beijing Cuiwei Tower Co., Ltd.'s historical financial information and projections.
- Discounted Cash Flow Model: An editable DCF valuation model featuring automatic calculations.
- Weighted Average Cost of Capital (WACC): A dedicated sheet for WACC calculations based on user-defined inputs.
- Key Financial Ratios: Evaluate Beijing Cuiwei Tower Co., Ltd.'s profitability, efficiency, and leverage metrics.
- Customizable Inputs: Easily modify revenue growth rates, profit margins, and tax rates.
- Clear Dashboard: Visual representations and tables summarizing essential valuation outcomes.
Disclaimer
All information, articles, and product details provided on this website are for general informational and educational purposes only. We do not claim any ownership over, nor do we intend to infringe upon, any trademarks, copyrights, logos, brand names, or other intellectual property mentioned or depicted on this site. Such intellectual property remains the property of its respective owners, and any references here are made solely for identification or informational purposes, without implying any affiliation, endorsement, or partnership.
We make no representations or warranties, express or implied, regarding the accuracy, completeness, or suitability of any content or products presented. Nothing on this website should be construed as legal, tax, investment, financial, medical, or other professional advice. In addition, no part of this site—including articles or product references—constitutes a solicitation, recommendation, endorsement, advertisement, or offer to buy or sell any securities, franchises, or other financial instruments, particularly in jurisdictions where such activity would be unlawful.
All content is of a general nature and may not address the specific circumstances of any individual or entity. It is not a substitute for professional advice or services. Any actions you take based on the information provided here are strictly at your own risk. You accept full responsibility for any decisions or outcomes arising from your use of this website and agree to release us from any liability in connection with your use of, or reliance upon, the content or products found herein.