
|
Wuxi Shangji Automation Co., Ltd. (603185.SS) DCF Valuation |
Fully Editable: Tailor To Your Needs In Excel Or Sheets
Professional Design: Trusted, Industry-Standard Templates
Investor-Approved Valuation Models
MAC/PC Compatible, Fully Unlocked
No Expertise Is Needed; Easy To Follow
Wuxi Shangji Automation Co., Ltd. (603185.SS) Bundle
Evaluate the financial outlook of Wuxi Shangji Automation Co., Ltd. like an expert! This (603185SS) DCF Calculator comes with pre-filled financials and offers full flexibility to modify revenue growth, WACC, margins, and other critical assumptions to align with your projections.
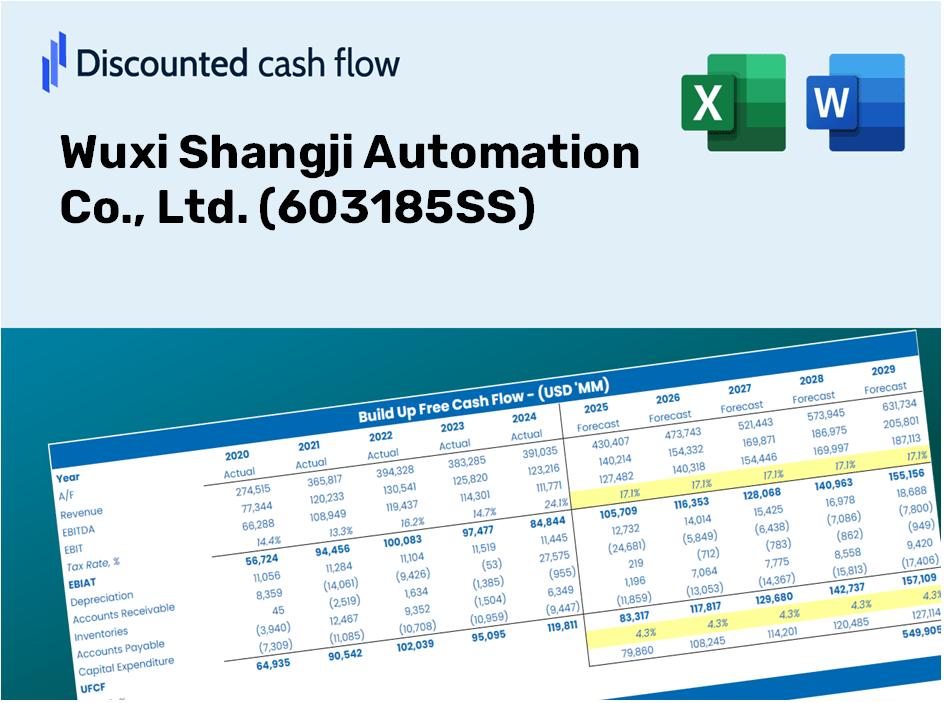
Discounted Cash Flow (DCF) - (USD MM)
| Year | AY1 2020 |
AY2 2021 |
AY3 2022 |
AY4 2023 |
AY5 2024 |
FY1 2025 |
FY2 2026 |
FY3 2027 |
FY4 2028 |
FY5 2029 |
|---|---|---|---|---|---|---|---|---|---|---|
| Revenue | 3,011.0 | 10,915.3 | 21,909.4 | 11,858.9 | 7,302.4 | 9,414.6 | 12,137.9 | 15,648.9 | 20,175.6 | 26,011.5 |
| Revenue Growth, % | 0 | 262.51 | 100.72 | -45.87 | -38.42 | 28.93 | 28.93 | 28.93 | 28.93 | 28.93 |
| EBITDA | 699.7 | 1,926.8 | 3,500.1 | 891.6 | -1,031.7 | 946.3 | 1,220.0 | 1,572.9 | 2,027.9 | 2,614.4 |
| EBITDA, % | 23.24 | 17.65 | 15.98 | 7.52 | -14.13 | 10.05 | 10.05 | 10.05 | 10.05 | 10.05 |
| Depreciation | 87.9 | 234.5 | 393.7 | 520.9 | 1,103.5 | 496.5 | 640.1 | 825.3 | 1,064.0 | 1,371.8 |
| Depreciation, % | 2.92 | 2.15 | 1.8 | 4.39 | 15.11 | 5.27 | 5.27 | 5.27 | 5.27 | 5.27 |
| EBIT | 611.8 | 1,692.4 | 3,106.4 | 370.8 | -2,135.3 | 449.8 | 579.9 | 747.6 | 963.9 | 1,242.7 |
| EBIT, % | 20.32 | 15.5 | 14.18 | 3.13 | -29.24 | 4.78 | 4.78 | 4.78 | 4.78 | 4.78 |
| Total Cash | 561.4 | 3,834.7 | 7,218.3 | 7,788.7 | 9,629.5 | 4,752.5 | 6,127.3 | 7,899.6 | 10,184.7 | 13,130.7 |
| Total Cash, percent | .0 | .0 | .0 | .0 | .0 | .0 | .0 | .0 | .0 | .0 |
| Account Receivables | 807.2 | 1,241.6 | 654.0 | 639.5 | 1,807.3 | 1,342.7 | 1,731.1 | 2,231.8 | 2,877.4 | 3,709.7 |
| Account Receivables, % | 26.81 | 11.37 | 2.98 | 5.39 | 24.75 | 14.26 | 14.26 | 14.26 | 14.26 | 14.26 |
| Inventories | 707.5 | 2,444.5 | 1,473.8 | 2,057.2 | 1,395.5 | 1,677.3 | 2,162.4 | 2,787.9 | 3,594.4 | 4,634.1 |
| Inventories, % | 23.5 | 22.39 | 6.73 | 17.35 | 19.11 | 17.82 | 17.82 | 17.82 | 17.82 | 17.82 |
| Accounts Payable | 1,139.4 | 5,650.8 | 7,016.0 | 10,853.0 | 5,713.6 | 5,486.8 | 7,073.8 | 9,120.0 | 11,758.1 | 15,159.2 |
| Accounts Payable, % | 37.84 | 51.77 | 32.02 | 91.52 | 78.24 | 58.28 | 58.28 | 58.28 | 58.28 | 58.28 |
| Capital Expenditure | -701.4 | -849.5 | -956.3 | -3,666.1 | -1,686.9 | -1,684.4 | -2,171.7 | -2,799.9 | -3,609.7 | -4,653.9 |
| Capital Expenditure, % | -23.3 | -7.78 | -4.36 | -30.91 | -23.1 | -17.89 | -17.89 | -17.89 | -17.89 | -17.89 |
| Tax Rate, % | 0.78098 | 0.78098 | 0.78098 | 0.78098 | 0.78098 | 0.78098 | 0.78098 | 0.78098 | 0.78098 | 0.78098 |
| EBITAT | 530.7 | 1,487.4 | 2,829.0 | 395.3 | -2,118.6 | 418.2 | 539.2 | 695.2 | 896.3 | 1,155.5 |
| Depreciation | ||||||||||
| Changes in Account Receivables | ||||||||||
| Changes in Inventories | ||||||||||
| Changes in Accounts Payable | ||||||||||
| Capital Expenditure | ||||||||||
| UFCF | -458.1 | 3,212.5 | 5,189.8 | 518.0 | -8,347.4 | -813.7 | -278.8 | -359.5 | -463.5 | -597.5 |
| WACC, % | 4.77 | 4.79 | 4.84 | 4.98 | 4.97 | 4.87 | 4.87 | 4.87 | 4.87 | 4.87 |
| PV UFCF | ||||||||||
| SUM PV UFCF | -2,195.4 | |||||||||
| Long Term Growth Rate, % | 3.50 | |||||||||
| Free cash flow (T + 1) | -618 | |||||||||
| Terminal Value | -45,170 | |||||||||
| Present Terminal Value | -35,613 | |||||||||
| Enterprise Value | -37,808 | |||||||||
| Net Debt | 5,725 | |||||||||
| Equity Value | -43,534 | |||||||||
| Diluted Shares Outstanding, MM | 624 | |||||||||
| Equity Value Per Share | -69.77 |
What You Will Receive
- Genuine Wuxi Shangji Financials: Comprehensive historical and projected data for precise valuation.
- Customizable Inputs: Adjust discount rates, tax figures, revenue growth, and capital outlays.
- Real-Time Calculations: Intrinsic value and NPV computed automatically.
- Scenario Planning: Evaluate various scenarios to analyze Wuxi Shangji’s potential future performance.
- User-Friendly Interface: Designed for professionals while remaining accessible to newcomers.
Key Features
- Comprehensive DCF Calculator: Offers detailed unlevered and levered DCF valuation frameworks tailored for Wuxi Shangji Automation Co., Ltd. (603185SS).
- WACC Calculator: Features a pre-configured Weighted Average Cost of Capital sheet with options for customization.
- Adjustable Forecast Assumptions: Easily update growth projections, capital spending, and discount rates as needed.
- Integrated Financial Ratios: Evaluate profitability, leverage, and efficiency ratios specifically for Wuxi Shangji Automation Co., Ltd. (603185SS).
- Interactive Dashboard and Charts: Visual representations present essential valuation metrics for straightforward analysis.
How It Works
- Step 1: Download the ready-to-use Excel template featuring Wuxi Shangji Automation Co., Ltd. (603185SS) data.
- Step 2: Examine the pre-populated sheets to familiarize yourself with the important metrics.
- Step 3: Adjust forecasts and assumptions in the editable yellow cells (WACC, growth, margins).
- Step 4: Instantly see the recalculated results, including the intrinsic value of Wuxi Shangji Automation Co., Ltd. (603185SS).
- Step 5: Use the outputs to make well-informed investment decisions or create detailed reports.
Why Opt for Wuxi Shangji Automation's Calculator?
- All-in-One Solution: Features DCF, WACC, and a variety of financial ratio analyses seamlessly integrated.
- Flexible Inputs: Modify the highlighted cells to experiment with different financial scenarios.
- In-Depth Analysis: Automatically computes the intrinsic value and Net Present Value for Wuxi Shangji Automation Co., Ltd. (603185SS).
- Preloaded Information: Comes with historical and forecasted data to provide an accurate baseline.
- High-Quality Output: Perfect for financial analysts, investors, and business consultants seeking professional insights.
Who Can Benefit from This Product?
- Institutional Investors: Develop comprehensive and accurate valuation models for assessing portfolios involving Wuxi Shangji Automation Co., Ltd. (603185SS).
- Corporate Development Teams: Evaluate valuation scenarios to inform strategic planning within the organization.
- Financial Consultants: Deliver precise valuation analyses to clients focused on Wuxi Shangji Automation Co., Ltd. (603185SS).
- Academics and Learners: Utilize real market data to enhance skills in financial modeling and analysis.
- Industry Analysts: Gain insights into the valuation methods applicable to automation companies like Wuxi Shangji Automation Co., Ltd. (603185SS).
Contents of the Template
- Pre-Filled Data: Contains historical financials and forecasts for Wuxi Shangji Automation Co., Ltd. (603185SS).
- Discounted Cash Flow Model: An editable DCF valuation model with automatic calculations.
- Weighted Average Cost of Capital (WACC): A dedicated sheet for WACC calculations based on your custom inputs.
- Key Financial Ratios: Evaluate Wuxi Shangji Automation's profitability, efficiency, and leverage.
- Customizable Inputs: Easily adjust revenue growth, margins, and tax rates.
- Clear Dashboard: Charts and tables that summarize essential valuation results.
Disclaimer
All information, articles, and product details provided on this website are for general informational and educational purposes only. We do not claim any ownership over, nor do we intend to infringe upon, any trademarks, copyrights, logos, brand names, or other intellectual property mentioned or depicted on this site. Such intellectual property remains the property of its respective owners, and any references here are made solely for identification or informational purposes, without implying any affiliation, endorsement, or partnership.
We make no representations or warranties, express or implied, regarding the accuracy, completeness, or suitability of any content or products presented. Nothing on this website should be construed as legal, tax, investment, financial, medical, or other professional advice. In addition, no part of this site—including articles or product references—constitutes a solicitation, recommendation, endorsement, advertisement, or offer to buy or sell any securities, franchises, or other financial instruments, particularly in jurisdictions where such activity would be unlawful.
All content is of a general nature and may not address the specific circumstances of any individual or entity. It is not a substitute for professional advice or services. Any actions you take based on the information provided here are strictly at your own risk. You accept full responsibility for any decisions or outcomes arising from your use of this website and agree to release us from any liability in connection with your use of, or reliance upon, the content or products found herein.