
|
Shanghai Baolong Automotive Corporation (603197.SS) DCF Valuation |
Fully Editable: Tailor To Your Needs In Excel Or Sheets
Professional Design: Trusted, Industry-Standard Templates
Investor-Approved Valuation Models
MAC/PC Compatible, Fully Unlocked
No Expertise Is Needed; Easy To Follow
Shanghai Baolong Automotive Corporation (603197.SS) Bundle
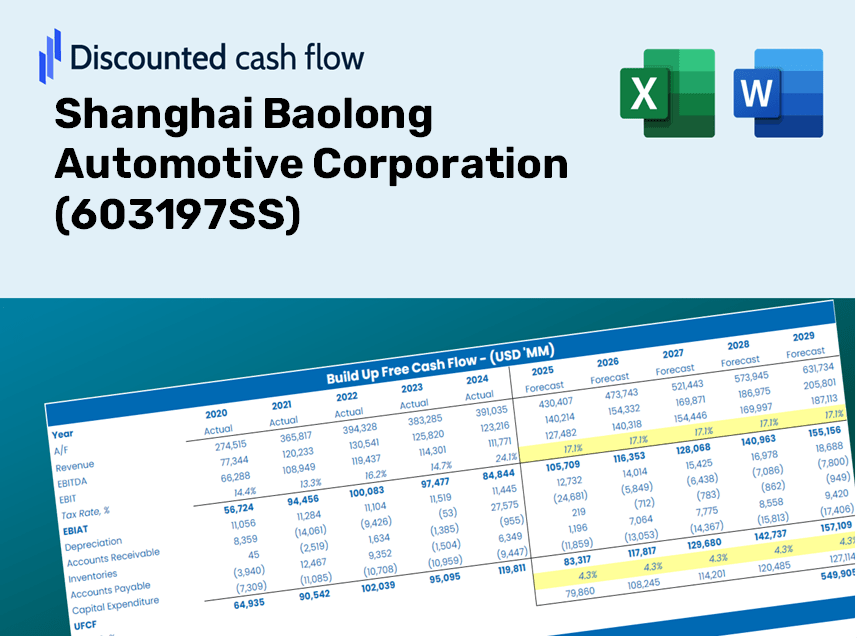
Gain mastery over your Shanghai Baolong Automotive Corporation (603197SS) valuation analysis using our state-of-the-art DCF Calculator! This Excel template comes preloaded with authentic (603197SS) data, enabling you to modify forecasts and assumptions for an accurate calculation of Shanghai Baolong's intrinsic value.
Discounted Cash Flow (DCF) - (USD MM)
| Year | AY1 2020 |
AY2 2021 |
AY3 2022 |
AY4 2023 |
AY5 2024 |
FY1 2025 |
FY2 2026 |
FY3 2027 |
FY4 2028 |
FY5 2029 |
|---|---|---|---|---|---|---|---|---|---|---|
| Revenue | 3,331.1 | 3,897.6 | 4,777.7 | 5,897.5 | 7,024.9 | 8,467.5 | 10,206.3 | 12,302.2 | 14,828.5 | 17,873.6 |
| Revenue Growth, % | 0 | 17.01 | 22.58 | 23.44 | 19.12 | 20.54 | 20.54 | 20.54 | 20.54 | 20.54 |
| EBITDA | 380.8 | 451.7 | 542.5 | 684.1 | 746.2 | 958.5 | 1,155.3 | 1,392.6 | 1,678.6 | 2,023.2 |
| EBITDA, % | 11.43 | 11.59 | 11.35 | 11.6 | 10.62 | 11.32 | 11.32 | 11.32 | 11.32 | 11.32 |
| Depreciation | 131.7 | 151.5 | 177.3 | 209.3 | 256.8 | 317.7 | 382.9 | 461.5 | 556.3 | 670.5 |
| Depreciation, % | 3.95 | 3.89 | 3.71 | 3.55 | 3.66 | 3.75 | 3.75 | 3.75 | 3.75 | 3.75 |
| EBIT | 249.2 | 300.2 | 365.1 | 474.7 | 489.4 | 640.8 | 772.4 | 931.1 | 1,122.3 | 1,352.7 |
| EBIT, % | 7.48 | 7.7 | 7.64 | 8.05 | 6.97 | 7.57 | 7.57 | 7.57 | 7.57 | 7.57 |
| Total Cash | 529.6 | 1,107.8 | 858.2 | 1,043.6 | 1,264.2 | 1,659.2 | 1,999.9 | 2,410.6 | 2,905.6 | 3,502.3 |
| Total Cash, percent | .0 | .0 | .0 | .0 | .0 | .0 | .0 | .0 | .0 | .0 |
| Account Receivables | 872.3 | 929.9 | 1,310.2 | 1,924.4 | 2,841.8 | 2,549.6 | 3,073.2 | 3,704.3 | 4,464.9 | 5,381.8 |
| Account Receivables, % | 26.19 | 23.86 | 27.42 | 32.63 | 40.45 | 30.11 | 30.11 | 30.11 | 30.11 | 30.11 |
| Inventories | 733.7 | 1,069.4 | 1,530.0 | 1,698.6 | 2,181.4 | 2,393.6 | 2,885.1 | 3,477.6 | 4,191.7 | 5,052.5 |
| Inventories, % | 22.02 | 27.44 | 32.02 | 28.8 | 31.05 | 28.27 | 28.27 | 28.27 | 28.27 | 28.27 |
| Accounts Payable | 388.0 | 679.2 | 1,031.4 | 1,039.2 | 2,321.0 | 1,715.9 | 2,068.3 | 2,493.0 | 3,005.0 | 3,622.1 |
| Accounts Payable, % | 11.65 | 17.43 | 21.59 | 17.62 | 33.04 | 20.26 | 20.26 | 20.26 | 20.26 | 20.26 |
| Capital Expenditure | -232.6 | -304.5 | -621.8 | -904.5 | -759.7 | -913.8 | -1,101.5 | -1,327.7 | -1,600.4 | -1,929.0 |
| Capital Expenditure, % | -6.98 | -7.81 | -13.02 | -15.34 | -10.81 | -10.79 | -10.79 | -10.79 | -10.79 | -10.79 |
| Tax Rate, % | 29.96 | 29.96 | 29.96 | 29.96 | 29.96 | 29.96 | 29.96 | 29.96 | 29.96 | 29.96 |
| EBITAT | 232.2 | 213.0 | 257.8 | 373.0 | 342.8 | 491.3 | 592.2 | 713.8 | 860.4 | 1,037.1 |
| Depreciation | ||||||||||
| Changes in Account Receivables | ||||||||||
| Changes in Inventories | ||||||||||
| Changes in Accounts Payable | ||||||||||
| Capital Expenditure | ||||||||||
| UFCF | -1,086.7 | -42.1 | -675.4 | -1,097.3 | -278.4 | -629.9 | -789.1 | -951.2 | -1,146.5 | -1,382.0 |
| WACC, % | 4.24 | 3.96 | 3.96 | 4.06 | 3.95 | 4.04 | 4.04 | 4.04 | 4.04 | 4.04 |
| PV UFCF | ||||||||||
| SUM PV UFCF | -4,291.9 | |||||||||
| Long Term Growth Rate, % | 4.00 | |||||||||
| Free cash flow (T + 1) | -1,437 | |||||||||
| Terminal Value | -4,037,776 | |||||||||
| Present Terminal Value | -3,313,084 | |||||||||
| Enterprise Value | -3,317,376 | |||||||||
| Net Debt | 2,842 | |||||||||
| Equity Value | -3,320,217 | |||||||||
| Diluted Shares Outstanding, MM | 210 | |||||||||
| Equity Value Per Share | -15,802.71 |
What Awaits You
- Customizable Excel Template: An entirely adjustable Excel-based DCF Calculator featuring pre-loaded financials for Shanghai Baolong Automotive Corporation (603197SS).
- Accurate Data: Access to historical performance data and forward-looking projections (highlighted in the yellow cells).
- Flexible Forecasting: Adjust key assumptions such as revenue growth, EBITDA %, and WACC to fit your analysis.
- Instant Calculations: View real-time effects of your inputs on the valuation of Shanghai Baolong Automotive Corporation (603197SS).
- Professional Resource: Designed for investors, CFOs, consultants, and financial analysts.
- User-Centric Interface: Organized for clarity and convenience, complete with step-by-step guidance.
Key Features
- Comprehensive Financial Data: Gain access to precise historical data and future forecasts specific to Shanghai Baolong Automotive Corporation (603197SS).
- Tailored Forecast Parameters: Modify yellow-highlighted cells, including WACC, growth rates, and profit margins.
- Real-Time Calculations: Automatic updates for DCF, Net Present Value (NPV), and cash flow analyses.
- User-Friendly Dashboard: Intuitive charts and summaries that make it easy to interpret your valuation results.
- Designed for All Skill Levels: A user-friendly layout suitable for investors, CFOs, and consultants alike.
How It Works
- Download: Get the pre-configured Excel file that contains Shanghai Baolong Automotive Corporation’s (603197SS) financial data.
- Customize: Tailor your forecasts by adjusting parameters such as revenue growth, EBITDA %, and WACC.
- Update Automatically: Watch as the intrinsic value and NPV calculations refresh in real-time.
- Test Scenarios: Generate multiple projections and compare the results instantly.
- Make Decisions: Leverage the valuation outcomes to inform your investment strategy.
Why Choose This Calculator for Shanghai Baolong Automotive Corporation (603197SS)?
- Comprehensive Tool: Offers integrated DCF, WACC, and financial ratio analyses tailored for automotive industry insights.
- Customizable Inputs: Easily modify the yellow-highlighted cells to explore different scenarios specific to Shanghai Baolong.
- Detailed Insights: Automatically computes the intrinsic value and Net Present Value for Shanghai Baolong Automotive Corporation.
- Preloaded Data: Includes historical and projected data to provide accurate starting points for your analysis.
- Professional Quality: Designed for financial analysts, investors, and consultants focusing on the automotive sector.
Who Can Benefit from This Product?
- Investors: Accurately assess the fair value of Shanghai Baolong Automotive Corporation (603197SS) prior to making investment choices.
- CFOs: Utilize a professional-grade DCF model for comprehensive financial reporting and analysis.
- Consultants: Easily modify the template for valuation reports tailored to clients.
- Entrepreneurs: Discover financial modeling techniques employed by leading automotive firms.
- Educators: Implement it as an educational resource to illustrate valuation methodologies.
Contents of the Template
- Preloaded 603197SS Data: Historical and projected financial metrics, encompassing revenue, EBIT, and capital expenditures.
- DCF and WACC Models: Professional spreadsheets designed for calculating intrinsic value and the Weighted Average Cost of Capital.
- Editable Inputs: Cells highlighted in yellow for customizing revenue growth, tax rates, and discount rates.
- Financial Statements: Detailed annual and quarterly financial reports for in-depth analysis.
- Key Ratios: Metrics for profitability, leverage, and efficiency to assess performance.
- Dashboard and Charts: Visual representations of valuation results and underlying assumptions.
Disclaimer
All information, articles, and product details provided on this website are for general informational and educational purposes only. We do not claim any ownership over, nor do we intend to infringe upon, any trademarks, copyrights, logos, brand names, or other intellectual property mentioned or depicted on this site. Such intellectual property remains the property of its respective owners, and any references here are made solely for identification or informational purposes, without implying any affiliation, endorsement, or partnership.
We make no representations or warranties, express or implied, regarding the accuracy, completeness, or suitability of any content or products presented. Nothing on this website should be construed as legal, tax, investment, financial, medical, or other professional advice. In addition, no part of this site—including articles or product references—constitutes a solicitation, recommendation, endorsement, advertisement, or offer to buy or sell any securities, franchises, or other financial instruments, particularly in jurisdictions where such activity would be unlawful.
All content is of a general nature and may not address the specific circumstances of any individual or entity. It is not a substitute for professional advice or services. Any actions you take based on the information provided here are strictly at your own risk. You accept full responsibility for any decisions or outcomes arising from your use of this website and agree to release us from any liability in connection with your use of, or reliance upon, the content or products found herein.