
|
Riyue Heavy Industry Co., Ltd. (603218.SS) DCF Valuation |
Fully Editable: Tailor To Your Needs In Excel Or Sheets
Professional Design: Trusted, Industry-Standard Templates
Investor-Approved Valuation Models
MAC/PC Compatible, Fully Unlocked
No Expertise Is Needed; Easy To Follow
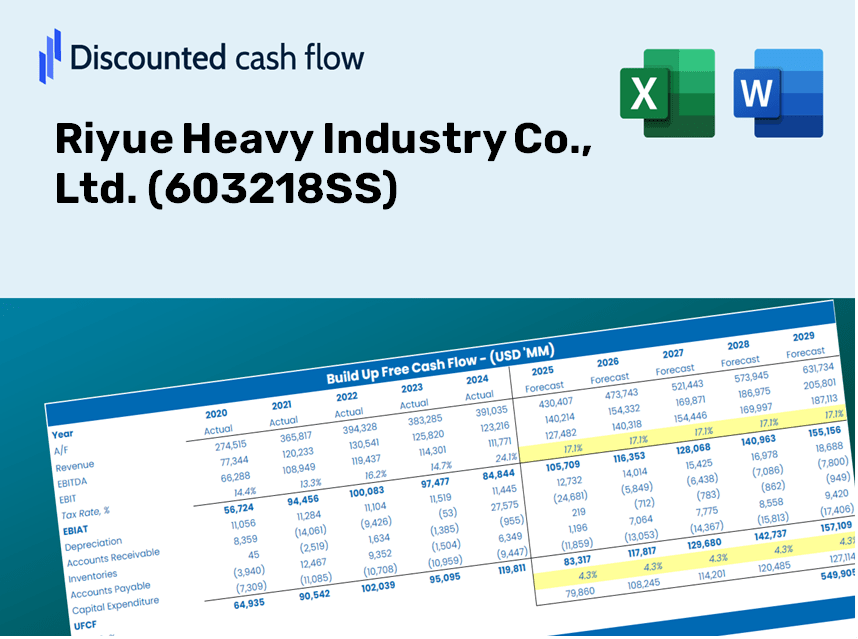
Riyue Heavy Industry Co., Ltd. (603218.SS) Bundle
As an investor or analyst, this (603218SS) DCF Calculator is your go-to resource for accurate valuation. Filled with real data from Riyue Heavy Industry Co., Ltd., you can adjust forecasts and instantly observe the effects.
Discounted Cash Flow (DCF) - (USD MM)
| Year | AY1 2020 |
AY2 2021 |
AY3 2022 |
AY4 2023 |
AY5 2024 |
FY1 2025 |
FY2 2026 |
FY3 2027 |
FY4 2028 |
FY5 2029 |
|---|---|---|---|---|---|---|---|---|---|---|
| Revenue | 5,110.6 | 4,712.1 | 4,865.0 | 4,655.6 | 4,695.9 | 4,602.1 | 4,510.2 | 4,420.1 | 4,331.8 | 4,245.3 |
| Revenue Growth, % | 0 | -7.8 | 3.25 | -4.3 | 0.86576 | -2 | -2 | -2 | -2 | -2 |
| EBITDA | 1,231.9 | 779.9 | 379.8 | 683.5 | 688.6 | 716.2 | 701.9 | 687.8 | 674.1 | 660.6 |
| EBITDA, % | 24.11 | 16.55 | 7.81 | 14.68 | 14.66 | 15.56 | 15.56 | 15.56 | 15.56 | 15.56 |
| Depreciation | 150.8 | 193.0 | 242.8 | 344.1 | 410.6 | 259.3 | 254.1 | 249.0 | 244.1 | 239.2 |
| Depreciation, % | 2.95 | 4.1 | 4.99 | 7.39 | 8.74 | 5.63 | 5.63 | 5.63 | 5.63 | 5.63 |
| EBIT | 1,081.2 | 586.9 | 137.1 | 339.4 | 278.0 | 456.9 | 447.7 | 438.8 | 430.0 | 421.4 |
| EBIT, % | 21.16 | 12.45 | 2.82 | 7.29 | 5.92 | 9.93 | 9.93 | 9.93 | 9.93 | 9.93 |
| Total Cash | 4,960.7 | 3,195.3 | 2,783.8 | 2,790.2 | 3,333.0 | 3,249.2 | 3,184.3 | 3,120.7 | 3,058.3 | 2,997.2 |
| Total Cash, percent | .0 | .0 | .0 | .0 | .0 | .0 | .0 | .0 | .0 | .0 |
| Account Receivables | 2,790.1 | 3,080.7 | 2,939.1 | 2,882.5 | 3,094.5 | 2,836.7 | 2,780.1 | 2,724.5 | 2,670.1 | 2,616.8 |
| Account Receivables, % | 54.59 | 65.38 | 60.41 | 61.91 | 65.9 | 61.64 | 61.64 | 61.64 | 61.64 | 61.64 |
| Inventories | 525.3 | 699.4 | 858.6 | 652.3 | 1,225.2 | 762.8 | 747.5 | 732.6 | 718.0 | 703.6 |
| Inventories, % | 10.28 | 14.84 | 17.65 | 14.01 | 26.09 | 16.57 | 16.57 | 16.57 | 16.57 | 16.57 |
| Accounts Payable | 920.8 | 1,929.1 | 2,542.5 | 2,343.5 | 1,165.8 | 1,715.5 | 1,681.2 | 1,647.6 | 1,614.7 | 1,582.5 |
| Accounts Payable, % | 18.02 | 40.94 | 52.26 | 50.34 | 24.82 | 37.28 | 37.28 | 37.28 | 37.28 | 37.28 |
| Capital Expenditure | -467.4 | -282.2 | -1,178.9 | -1,800.0 | -762.8 | -867.7 | -850.4 | -833.4 | -816.7 | -800.4 |
| Capital Expenditure, % | -9.15 | -5.99 | -24.23 | -38.66 | -16.24 | -18.85 | -18.85 | -18.85 | -18.85 | -18.85 |
| Tax Rate, % | 8.24 | 8.24 | 8.24 | 8.24 | 8.24 | 8.24 | 8.24 | 8.24 | 8.24 | 8.24 |
| EBITAT | 934.9 | 516.6 | 139.9 | 334.4 | 255.1 | 424.7 | 416.2 | 407.9 | 399.7 | 391.7 |
| Depreciation | ||||||||||
| Changes in Account Receivables | ||||||||||
| Changes in Inventories | ||||||||||
| Changes in Accounts Payable | ||||||||||
| Capital Expenditure | ||||||||||
| UFCF | -1,776.4 | 971.1 | -200.5 | -1,057.5 | -2,059.9 | 1,086.2 | -142.4 | -139.6 | -136.8 | -134.1 |
| WACC, % | 5.25 | 5.25 | 5.3 | 5.29 | 5.27 | 5.27 | 5.27 | 5.27 | 5.27 | 5.27 |
| PV UFCF | ||||||||||
| SUM PV UFCF | 568.6 | |||||||||
| Long Term Growth Rate, % | 4.00 | |||||||||
| Free cash flow (T + 1) | -139 | |||||||||
| Terminal Value | -10,973 | |||||||||
| Present Terminal Value | -8,488 | |||||||||
| Enterprise Value | -7,919 | |||||||||
| Net Debt | -1,202 | |||||||||
| Equity Value | -6,718 | |||||||||
| Diluted Shares Outstanding, MM | 1,023 | |||||||||
| Equity Value Per Share | -6.57 |
Benefits You Will Receive
- Customizable Excel Template: A fully adaptable Excel-based DCF Calculator featuring pre-populated financial data for Riyue Heavy Industry Co., Ltd. (603218SS).
- Accurate Market Data: Access to historical data as well as forward-looking projections (highlighted in the yellow cells).
- Flexible Forecasting: Adjust forecast variables such as revenue growth, EBITDA percentage, and WACC to suit your analysis.
- Instant Calculations: Quickly observe how your inputs affect the valuation of Riyue Heavy Industry Co., Ltd. (603218SS).
- Professional-Grade Tool: Designed for investors, CFOs, consultants, and financial analysts.
- User-Friendly Layout: Organized for straightforward navigation and usability, complete with detailed step-by-step instructions.
Key Features
- Customizable Forecasting Inputs: Adjust vital factors such as revenue growth, EBITDA margin, and capital expenditures.
- Instant DCF Valuation: Automatically computes intrinsic value, NPV, and other financial metrics in real time.
- High-Precision Accuracy: Leverages Riyue Heavy Industry Co., Ltd.'s [603218SS] actual financial data for dependable valuation results.
- Simplified Scenario Analysis: Easily explore various assumptions and compare the resulting scenarios.
- Efficiency Booster: Remove the hassle of manually constructing intricate valuation models from the ground up.
How It Functions
- Step 1: Download the Excel file.
- Step 2: Examine Riyue Heavy Industry Co., Ltd.’s pre-filled financial data and projections.
- Step 3: Adjust key variables such as revenue growth, WACC, and tax rates (highlighted cells).
- Step 4: Observe the DCF model refresh in real-time as you alter the assumptions.
- Step 5: Evaluate the outputs and leverage the findings for investment strategies.
Why Opt for Riyue Heavy Industry Co., Ltd. (603218SS)?
- Time-Efficient: Eliminate the hassle of building a model from the ground up – it's pre-configured for your use.
- Enhanced Accuracy: Dependable financial data and calculations minimize valuation errors.
- Completely Customizable: Adjust the model to align with your specific assumptions and forecasts.
- Simple to Understand: Intuitive charts and outputs facilitate straightforward analysis of results.
- Endorsed by Industry Professionals: Crafted for experts who prioritize precision and functionality.
Who Can Benefit from This Product?
- Investors: Evaluate the fair value of Riyue Heavy Industry Co., Ltd. (603218SS) effectively prior to making investment choices.
- CFOs: Utilize a top-tier DCF model for comprehensive financial reporting and analysis.
- Consultants: Easily customize the template for client valuation reports.
- Entrepreneurs: Acquire insights into the financial modeling practices of leading industrial companies.
- Educators: Employ this resource as a teaching aid to showcase various valuation techniques.
Contents of the Template
- Comprehensive DCF Model: An editable framework featuring detailed valuation calculations.
- Real-World Data: Historical and projected financial data for Riyue Heavy Industry Co., Ltd. (603218SS) included for analysis.
- Customizable Parameters: Modify WACC, growth rates, and tax assumptions to explore different scenarios.
- Financial Statements: Complete annual and quarterly financial breakdowns for in-depth insights.
- Key Ratios: Integrated analysis covering profitability, efficiency, and leverage metrics.
- Dashboard with Visual Outputs: Visualizations including charts and tables for clear and actionable insights.
Disclaimer
All information, articles, and product details provided on this website are for general informational and educational purposes only. We do not claim any ownership over, nor do we intend to infringe upon, any trademarks, copyrights, logos, brand names, or other intellectual property mentioned or depicted on this site. Such intellectual property remains the property of its respective owners, and any references here are made solely for identification or informational purposes, without implying any affiliation, endorsement, or partnership.
We make no representations or warranties, express or implied, regarding the accuracy, completeness, or suitability of any content or products presented. Nothing on this website should be construed as legal, tax, investment, financial, medical, or other professional advice. In addition, no part of this site—including articles or product references—constitutes a solicitation, recommendation, endorsement, advertisement, or offer to buy or sell any securities, franchises, or other financial instruments, particularly in jurisdictions where such activity would be unlawful.
All content is of a general nature and may not address the specific circumstances of any individual or entity. It is not a substitute for professional advice or services. Any actions you take based on the information provided here are strictly at your own risk. You accept full responsibility for any decisions or outcomes arising from your use of this website and agree to release us from any liability in connection with your use of, or reliance upon, the content or products found herein.