
|
Xinfengming Group Co., Ltd. (603225.SS) DCF Valuation |
Fully Editable: Tailor To Your Needs In Excel Or Sheets
Professional Design: Trusted, Industry-Standard Templates
Investor-Approved Valuation Models
MAC/PC Compatible, Fully Unlocked
No Expertise Is Needed; Easy To Follow
Xinfengming Group Co., Ltd. (603225.SS) Bundle
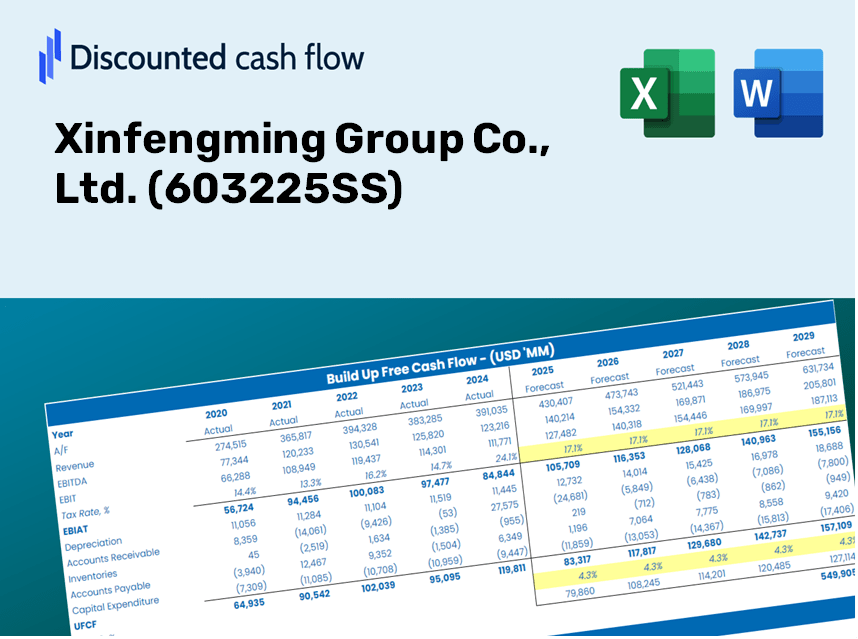
Simplify Xinfengming Group Co., Ltd. valuation with this customizable DCF Calculator! Featuring real Xinfengming Group Co., Ltd. financials and adjustable forecast inputs, you can test scenarios and uncover Xinfengming Group Co., Ltd. fair value in minutes.
Discounted Cash Flow (DCF) - (USD MM)
| Year | AY1 2020 |
AY2 2021 |
AY3 2022 |
AY4 2023 |
AY5 2024 |
FY1 2025 |
FY2 2026 |
FY3 2027 |
FY4 2028 |
FY5 2029 |
|---|---|---|---|---|---|---|---|---|---|---|
| Revenue | 36,984.1 | 44,770.0 | 50,787.3 | 61,292.4 | 67,090.6 | 77,931.8 | 90,525.0 | 105,153.1 | 122,145.0 | 141,882.7 |
| Revenue Growth, % | 0 | 21.05 | 13.44 | 20.68 | 9.46 | 16.16 | 16.16 | 16.16 | 16.16 | 16.16 |
| EBITDA | 2,740.2 | 5,562.1 | 2,840.7 | 4,867.3 | 5,079.6 | 6,380.8 | 7,411.9 | 8,609.6 | 10,000.9 | 11,616.9 |
| EBITDA, % | 7.41 | 12.42 | 5.59 | 7.94 | 7.57 | 8.19 | 8.19 | 8.19 | 8.19 | 8.19 |
| Depreciation | 1,725.6 | 2,278.7 | 2,541.0 | 2,841.1 | 2,994.3 | 3,718.5 | 4,319.3 | 5,017.3 | 5,828.1 | 6,769.8 |
| Depreciation, % | 4.67 | 5.09 | 5 | 4.64 | 4.46 | 4.77 | 4.77 | 4.77 | 4.77 | 4.77 |
| EBIT | 1,014.6 | 3,283.4 | 299.7 | 2,026.2 | 2,085.3 | 2,662.4 | 3,092.6 | 3,592.3 | 4,172.8 | 4,847.1 |
| EBIT, % | 2.74 | 7.33 | 0.59011 | 3.31 | 3.11 | 3.42 | 3.42 | 3.42 | 3.42 | 3.42 |
| Total Cash | 3,399.4 | 5,647.8 | 6,302.7 | 8,114.2 | 10,183.3 | 9,762.3 | 11,339.8 | 13,172.3 | 15,300.8 | 17,773.3 |
| Total Cash, percent | .0 | .0 | .0 | .0 | .0 | .0 | .0 | .0 | .0 | .0 |
| Account Receivables | 844.6 | 1,174.1 | 832.7 | 1,467.9 | 1,443.9 | 1,729.0 | 2,008.4 | 2,332.9 | 2,709.9 | 3,147.8 |
| Account Receivables, % | 2.28 | 2.62 | 1.64 | 2.39 | 2.15 | 2.22 | 2.22 | 2.22 | 2.22 | 2.22 |
| Inventories | 1,672.5 | 3,221.6 | 3,718.8 | 4,308.7 | 4,451.8 | 5,097.6 | 5,921.4 | 6,878.2 | 7,989.7 | 9,280.7 |
| Inventories, % | 4.52 | 7.2 | 7.32 | 7.03 | 6.64 | 6.54 | 6.54 | 6.54 | 6.54 | 6.54 |
| Accounts Payable | 1,511.7 | 1,681.8 | 2,232.6 | 2,633.4 | 5,943.0 | 3,958.1 | 4,597.7 | 5,340.7 | 6,203.7 | 7,206.1 |
| Accounts Payable, % | 4.09 | 3.76 | 4.4 | 4.3 | 8.86 | 5.08 | 5.08 | 5.08 | 5.08 | 5.08 |
| Capital Expenditure | -6,043.7 | -6,293.3 | -5,376.7 | -3,348.6 | -7,055.4 | -8,878.7 | -10,313.5 | -11,980.0 | -13,915.9 | -16,164.6 |
| Capital Expenditure, % | -16.34 | -14.06 | -10.59 | -5.46 | -10.52 | -11.39 | -11.39 | -11.39 | -11.39 | -11.39 |
| Tax Rate, % | 12.45 | 12.45 | 12.45 | 12.45 | 12.45 | 12.45 | 12.45 | 12.45 | 12.45 | 12.45 |
| EBITAT | 953.4 | 2,768.9 | 132.0 | 1,873.9 | 1,825.7 | 2,142.6 | 2,488.8 | 2,891.0 | 3,358.2 | 3,900.8 |
| Depreciation | ||||||||||
| Changes in Account Receivables | ||||||||||
| Changes in Inventories | ||||||||||
| Changes in Accounts Payable | ||||||||||
| Capital Expenditure | ||||||||||
| UFCF | -4,370.1 | -2,954.3 | -2,308.6 | 542.1 | 955.1 | -5,933.4 | -3,968.8 | -4,610.1 | -5,355.1 | -6,220.5 |
| WACC, % | 6.8 | 6.62 | 5.88 | 6.77 | 6.68 | 6.55 | 6.55 | 6.55 | 6.55 | 6.55 |
| PV UFCF | ||||||||||
| SUM PV UFCF | -21,560.1 | |||||||||
| Long Term Growth Rate, % | 3.50 | |||||||||
| Free cash flow (T + 1) | -6,438 | |||||||||
| Terminal Value | -211,085 | |||||||||
| Present Terminal Value | -153,706 | |||||||||
| Enterprise Value | -175,266 | |||||||||
| Net Debt | 13,703 | |||||||||
| Equity Value | -188,969 | |||||||||
| Diluted Shares Outstanding, MM | 1,498 | |||||||||
| Equity Value Per Share | -126.14 |
Benefits You'll Enjoy
- Genuine Xinfengming Financials: Access to historical and projected data for precise valuation.
- Customizable Inputs: Adjust metrics such as WACC, tax rates, revenue growth, and capital expenditures.
- Real-Time Calculations: Calculates intrinsic value and NPV automatically.
- What-If Analysis: Explore various scenarios to assess Xinfengming's future performance.
- User-Friendly Interface: Designed for professionals while remaining user-friendly for newcomers.
Key Features
- Authentic Financial Data: Gain access to reliable historical figures and future forecasts for Xinfengming Group Co., Ltd. (603225SS).
- Tailorable Assumption Inputs: Modify highlighted cells, including WACC, growth rates, and profit margins to suit your analysis.
- Real-Time Calculations: Benefit from automatic adjustments to DCF, Net Present Value (NPV), and cash flow assessments.
- User-Friendly Dashboard: View comprehensive charts and summaries for easy interpretation of your valuation findings.
- Designed for All Levels: A straightforward and intuitive format catering to investors, CFOs, and consultants alike.
How It Functions
- Step 1: Download the ready-made Excel template featuring data for Xinfengming Group Co., Ltd. (603225SS).
- Step 2: Review the pre-filled sheets to familiarize yourself with the essential metrics.
- Step 3: Modify forecasts and assumptions in the editable yellow cells (WACC, growth, margins).
- Step 4: Instantly access recalculated results, including the intrinsic value of Xinfengming Group Co., Ltd. (603225SS).
- Step 5: Utilize the outputs to make informed investment decisions or create reports.
Why Opt for Xinfengming Group's Financial Calculator?
- Precision: Data derived from authentic Xinfengming Group financial reports ensures high accuracy.
- Adaptability: Tailored for users to easily adjust and experiment with various inputs.
- Efficiency: Eliminate the complexity of creating a DCF model from the ground up.
- Expert-Level: Crafted with the precision and functionality that CFOs would expect.
- Intuitive Design: Simple and straightforward, making it accessible for users with varying levels of financial expertise.
Who Can Benefit from This Product?
- Investors: Assess the valuation of Xinfengming Group Co., Ltd. (603225SS) prior to making stock transactions.
- CFOs and Financial Analysts: Optimize valuation processes and evaluate financial projections.
- Startup Founders: Understand the valuation methodology used for established companies like Xinfengming Group Co., Ltd. (603225SS).
- Consultants: Provide comprehensive valuation reports to your clients regarding Xinfengming Group Co., Ltd. (603225SS).
- Students and Educators: Utilize real market data to practice and teach valuation methods.
What the Template Includes
- Preloaded XFEN Data: Historical and projected financial information, such as revenue, EBIT, and capital expenditures.
- DCF and WACC Models: Professional-grade templates for calculating intrinsic value and Weighted Average Cost of Capital.
- Editable Inputs: Yellow-highlighted cells for adjusting revenue growth, tax rates, and discount rates.
- Financial Statements: Detailed annual and quarterly financial data for in-depth analysis.
- Key Ratios: Metrics on profitability, leverage, and efficiency for performance evaluation.
- Dashboard and Charts: Visual representations of valuation results and underlying assumptions.
Disclaimer
All information, articles, and product details provided on this website are for general informational and educational purposes only. We do not claim any ownership over, nor do we intend to infringe upon, any trademarks, copyrights, logos, brand names, or other intellectual property mentioned or depicted on this site. Such intellectual property remains the property of its respective owners, and any references here are made solely for identification or informational purposes, without implying any affiliation, endorsement, or partnership.
We make no representations or warranties, express or implied, regarding the accuracy, completeness, or suitability of any content or products presented. Nothing on this website should be construed as legal, tax, investment, financial, medical, or other professional advice. In addition, no part of this site—including articles or product references—constitutes a solicitation, recommendation, endorsement, advertisement, or offer to buy or sell any securities, franchises, or other financial instruments, particularly in jurisdictions where such activity would be unlawful.
All content is of a general nature and may not address the specific circumstances of any individual or entity. It is not a substitute for professional advice or services. Any actions you take based on the information provided here are strictly at your own risk. You accept full responsibility for any decisions or outcomes arising from your use of this website and agree to release us from any liability in connection with your use of, or reliance upon, the content or products found herein.