
|
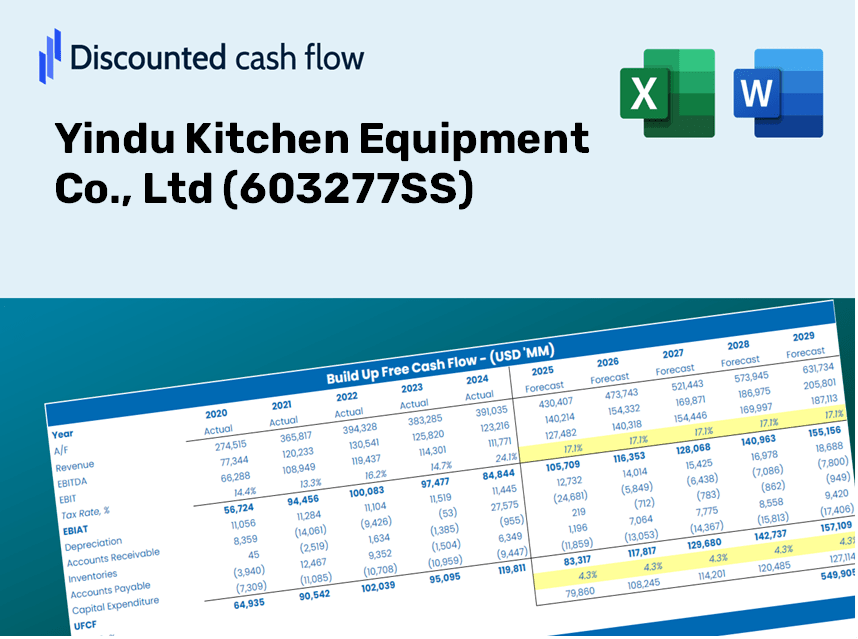
Yindu Kitchen Equipment Co., Ltd (603277.SS) DCF Valuation |
Fully Editable: Tailor To Your Needs In Excel Or Sheets
Professional Design: Trusted, Industry-Standard Templates
Investor-Approved Valuation Models
MAC/PC Compatible, Fully Unlocked
No Expertise Is Needed; Easy To Follow
Yindu Kitchen Equipment Co., Ltd (603277.SS) Bundle
Enhance your investment strategies with the Yindu Kitchen Equipment Co., Ltd (603277SS) DCF Calculator! Explore real financial data, adjust growth projections and expenses, and instantly observe how these modifications affect the intrinsic value of Yindu Kitchen Equipment Co., Ltd (603277SS).
Discounted Cash Flow (DCF) - (USD MM)
| Year | AY1 2020 |
AY2 2021 |
AY3 2022 |
AY4 2023 |
AY5 2024 |
FY1 2025 |
FY2 2026 |
FY3 2027 |
FY4 2028 |
FY5 2029 |
|---|---|---|---|---|---|---|---|---|---|---|
| Revenue | 1,614.3 | 2,458.7 | 2,662.9 | 2,652.5 | 2,752.5 | 3,192.9 | 3,703.7 | 4,296.2 | 4,983.5 | 5,780.7 |
| Revenue Growth, % | 0 | 52.31 | 8.3 | -0.38815 | 3.77 | 16 | 16 | 16 | 16 | 16 |
| EBITDA | 350.5 | 476.6 | 507.6 | 579.1 | 621.3 | 667.7 | 774.5 | 898.4 | 1,042.2 | 1,208.9 |
| EBITDA, % | 21.71 | 19.39 | 19.06 | 21.83 | 22.57 | 20.91 | 20.91 | 20.91 | 20.91 | 20.91 |
| Depreciation | 41.1 | 44.0 | 46.8 | 58.6 | 66.2 | 68.4 | 79.3 | 92.0 | 106.7 | 123.8 |
| Depreciation, % | 2.55 | 1.79 | 1.76 | 2.21 | 2.4 | 2.14 | 2.14 | 2.14 | 2.14 | 2.14 |
| EBIT | 309.3 | 432.6 | 460.8 | 520.5 | 555.1 | 599.3 | 695.2 | 806.4 | 935.4 | 1,085.1 |
| EBIT, % | 19.16 | 17.6 | 17.31 | 19.62 | 20.17 | 18.77 | 18.77 | 18.77 | 18.77 | 18.77 |
| Total Cash | 952.6 | 716.1 | 1,023.6 | 1,401.4 | 1,297.4 | 1,446.6 | 1,678.0 | 1,946.5 | 2,257.9 | 2,619.1 |
| Total Cash, percent | .0 | .0 | .0 | .0 | .0 | .0 | .0 | .0 | .0 | .0 |
| Account Receivables | 195.7 | 242.4 | 231.2 | 218.7 | 311.1 | 320.7 | 372.0 | 431.5 | 500.5 | 580.6 |
| Account Receivables, % | 12.12 | 9.86 | 8.68 | 8.25 | 11.3 | 10.04 | 10.04 | 10.04 | 10.04 | 10.04 |
| Inventories | 527.9 | 1,010.1 | 933.8 | 840.7 | 947.4 | 1,117.3 | 1,296.0 | 1,503.4 | 1,743.9 | 2,022.9 |
| Inventories, % | 32.7 | 41.08 | 35.07 | 31.69 | 34.42 | 34.99 | 34.99 | 34.99 | 34.99 | 34.99 |
| Accounts Payable | 225.0 | 69.7 | 19.1 | 51.7 | 281.6 | 189.5 | 219.8 | 254.9 | 295.7 | 343.0 |
| Accounts Payable, % | 13.94 | 2.83 | 0.71745 | 1.95 | 10.23 | 5.93 | 5.93 | 5.93 | 5.93 | 5.93 |
| Capital Expenditure | -101.1 | -205.7 | -154.6 | -211.9 | -230.8 | -235.1 | -272.7 | -316.3 | -366.9 | -425.6 |
| Capital Expenditure, % | -6.26 | -8.37 | -5.81 | -7.99 | -8.38 | -7.36 | -7.36 | -7.36 | -7.36 | -7.36 |
| Tax Rate, % | 13.96 | 13.96 | 13.96 | 13.96 | 13.96 | 13.96 | 13.96 | 13.96 | 13.96 | 13.96 |
| EBITAT | 257.9 | 375.5 | 391.9 | 458.4 | 477.6 | 514.6 | 596.9 | 692.4 | 803.2 | 931.7 |
| Depreciation | ||||||||||
| Changes in Account Receivables | ||||||||||
| Changes in Inventories | ||||||||||
| Changes in Accounts Payable | ||||||||||
| Capital Expenditure | ||||||||||
| UFCF | -300.7 | -470.5 | 321.0 | 443.3 | 343.8 | 76.3 | 203.8 | 236.4 | 274.3 | 318.2 |
| WACC, % | 7.23 | 7.24 | 7.23 | 7.24 | 7.23 | 7.23 | 7.23 | 7.23 | 7.23 | 7.23 |
| PV UFCF | ||||||||||
| SUM PV UFCF | 872.0 | |||||||||
| Long Term Growth Rate, % | 3.00 | |||||||||
| Free cash flow (T + 1) | 328 | |||||||||
| Terminal Value | 7,740 | |||||||||
| Present Terminal Value | 5,458 | |||||||||
| Enterprise Value | 6,330 | |||||||||
| Net Debt | -693 | |||||||||
| Equity Value | 7,023 | |||||||||
| Diluted Shares Outstanding, MM | 419 | |||||||||
| Equity Value Per Share | 16.75 |
What You Will Receive
- Adjustable Forecast Parameters: Seamlessly modify key assumptions (growth %, margins, WACC) to explore various scenarios.
- Real-World Insights: Yindu Kitchen Equipment Co., Ltd's financial data pre-loaded to enhance your analysis.
- Instant DCF Calculations: The template automatically computes Net Present Value (NPV) and intrinsic value for you.
- Professional and Customizable: A refined Excel model tailored to meet your valuation requirements.
- Designed for Analysts and Investors: Perfect for evaluating projections, confirming strategies, and optimizing your time.
Key Features
- Comprehensive Yindu Data: Pre-filled with Yindu Kitchen Equipment’s historical performance and future projections.
- Fully Customizable Parameters: Modify revenue growth rates, profit margins, discount rates, tax liabilities, and capital investments.
- Dynamic Valuation Framework: Automatic recalculations of Net Present Value (NPV) and intrinsic value based on your entered parameters.
- Scenario Analysis: Develop multiple forecasting scenarios to explore various valuation possibilities.
- User-Friendly Interface: Intuitive, organized design suitable for both experienced professionals and newcomers.
How It Operates
- Download the Template: Gain immediate access to the Excel-based Yindu Kitchen Equipment DCF Calculator.
- Input Your Assumptions: Customize the yellow-highlighted fields for growth rates, WACC, margins, and other relevant metrics.
- Instant Calculations: The model will automatically adjust to reflect Yindu's intrinsic value.
- Test Scenarios: Explore various assumptions to assess potential changes in valuation.
- Analyze and Decide: Leverage the outcomes to inform your investment or financial assessments.
Why Choose Yindu Kitchen Equipment Co., Ltd Calculator?
- User-Friendly Interface: Tailored for both novice and seasoned users.
- Customizable Inputs: Modify assumptions easily to suit your analysis needs.
- Real-Time Adjustments: Observe immediate updates to Yindu’s valuation with input changes.
- Preloaded Data: Comes equipped with Yindu’s actual financial figures for efficient analysis.
- Preferred by Experts: Utilized by investors and analysts for making well-informed choices.
Who Can Benefit from Yindu Kitchen Equipment?
- Culinary Students: Explore equipment specifications and apply them in real-world kitchen settings.
- Chefs: Integrate high-quality kitchen solutions into your culinary creations and presentations.
- Restaurant Owners: Evaluate your current equipment and optimize operational efficiency with the latest technology from Yindu.
- Kitchen Designers: Utilize customizable kitchen equipment layouts to enhance functionality and aesthetics.
- Food Entrepreneurs: Discover insights into how established brands like Yindu approach kitchen equipment innovation.
What the Template Includes
- Comprehensive DCF Model: Fully editable template featuring intricate valuation calculations.
- Real-World Data: Historical and projected financials for Yindu Kitchen Equipment Co., Ltd (603277SS) preloaded for thorough analysis.
- Customizable Parameters: Adjust WACC, growth rates, and tax assumptions to explore various scenarios.
- Financial Statements: Detailed annual and quarterly breakdowns for enhanced insights.
- Key Ratios: Integrated analysis for profitability, efficiency, and leverage metrics.
- Dashboard with Visual Outputs: Charts and tables providing clear and actionable results.
Disclaimer
All information, articles, and product details provided on this website are for general informational and educational purposes only. We do not claim any ownership over, nor do we intend to infringe upon, any trademarks, copyrights, logos, brand names, or other intellectual property mentioned or depicted on this site. Such intellectual property remains the property of its respective owners, and any references here are made solely for identification or informational purposes, without implying any affiliation, endorsement, or partnership.
We make no representations or warranties, express or implied, regarding the accuracy, completeness, or suitability of any content or products presented. Nothing on this website should be construed as legal, tax, investment, financial, medical, or other professional advice. In addition, no part of this site—including articles or product references—constitutes a solicitation, recommendation, endorsement, advertisement, or offer to buy or sell any securities, franchises, or other financial instruments, particularly in jurisdictions where such activity would be unlawful.
All content is of a general nature and may not address the specific circumstances of any individual or entity. It is not a substitute for professional advice or services. Any actions you take based on the information provided here are strictly at your own risk. You accept full responsibility for any decisions or outcomes arising from your use of this website and agree to release us from any liability in connection with your use of, or reliance upon, the content or products found herein.