
|
Ningbo Yongxin Optics Co.,Ltd (603297.SS) DCF Valuation |
Fully Editable: Tailor To Your Needs In Excel Or Sheets
Professional Design: Trusted, Industry-Standard Templates
Investor-Approved Valuation Models
MAC/PC Compatible, Fully Unlocked
No Expertise Is Needed; Easy To Follow
Ningbo Yongxin Optics Co.,Ltd (603297.SS) Bundle
Discover the true potential of Ningbo Yongxin Optics Co., Ltd with our advanced DCF Calculator! Adjust key assumptions, explore various scenarios, and evaluate the effects of changes on Ningbo Yongxin Optics Co., Ltd valuation – all within a comprehensive Excel template.
Discounted Cash Flow (DCF) - (USD MM)
| Year | AY1 2020 |
AY2 2021 |
AY3 2022 |
AY4 2023 |
AY5 2024 |
FY1 2025 |
FY2 2026 |
FY3 2027 |
FY4 2028 |
FY5 2029 |
|---|---|---|---|---|---|---|---|---|---|---|
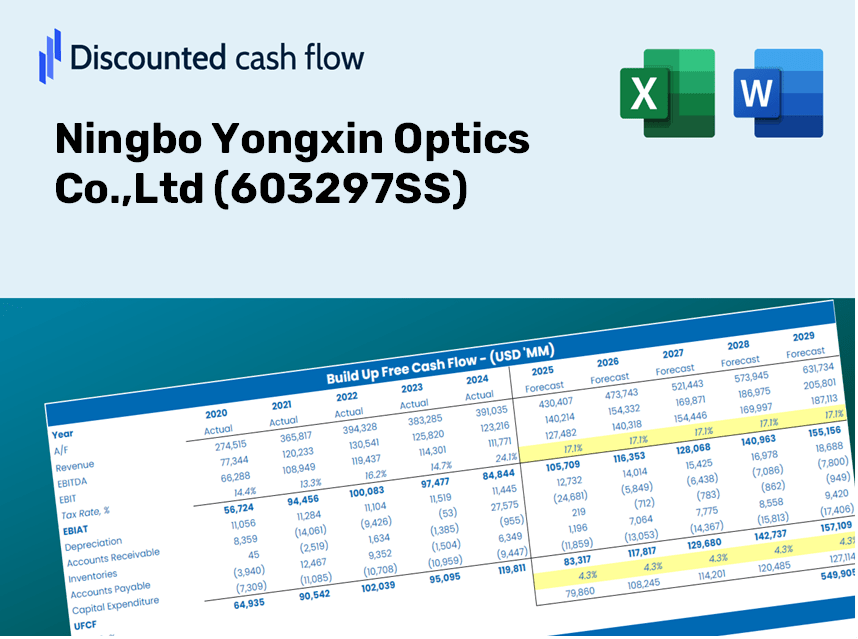
| Revenue | 576.4 | 795.1 | 829.1 | 854.1 | 891.8 | 1,002.4 | 1,126.8 | 1,266.7 | 1,423.9 | 1,600.6 |
| Revenue Growth, % | 0 | 37.94 | 4.27 | 3.02 | 4.41 | 12.41 | 12.41 | 12.41 | 12.41 | 12.41 |
| EBITDA | 134.8 | 211.6 | 202.7 | 169.1 | 191.5 | 232.0 | 260.8 | 293.2 | 329.6 | 370.5 |
| EBITDA, % | 23.39 | 26.62 | 24.45 | 19.8 | 21.47 | 23.15 | 23.15 | 23.15 | 23.15 | 23.15 |
| Depreciation | 19.1 | 21.3 | 24.1 | 33.6 | 36.4 | 33.9 | 38.1 | 42.8 | 48.2 | 54.1 |
| Depreciation, % | 3.32 | 2.68 | 2.9 | 3.93 | 4.08 | 3.38 | 3.38 | 3.38 | 3.38 | 3.38 |
| EBIT | 115.7 | 190.3 | 178.7 | 135.6 | 155.1 | 198.1 | 222.7 | 250.4 | 281.4 | 316.4 |
| EBIT, % | 20.07 | 23.94 | 21.55 | 15.87 | 17.39 | 19.76 | 19.76 | 19.76 | 19.76 | 19.76 |
| Total Cash | 608.9 | 849.8 | 940.3 | 998.3 | 1,064.3 | 1,002.4 | 1,126.8 | 1,266.7 | 1,423.9 | 1,600.6 |
| Total Cash, percent | .0 | .0 | .0 | .0 | .0 | .0 | .0 | .0 | .0 | .0 |
| Account Receivables | 139.5 | 168.0 | 185.8 | 201.6 | 217.0 | 231.9 | 260.7 | 293.1 | 329.4 | 370.3 |
| Account Receivables, % | 24.21 | 21.13 | 22.41 | 23.6 | 24.34 | 23.14 | 23.14 | 23.14 | 23.14 | 23.14 |
| Inventories | 122.5 | 175.3 | 187.8 | 199.0 | 189.8 | 221.6 | 249.1 | 280.0 | 314.8 | 353.8 |
| Inventories, % | 21.25 | 22.05 | 22.66 | 23.3 | 21.28 | 22.11 | 22.11 | 22.11 | 22.11 | 22.11 |
| Accounts Payable | 104.6 | 132.8 | 105.8 | 120.3 | 144.1 | 156.1 | 175.4 | 197.2 | 221.7 | 249.2 |
| Accounts Payable, % | 18.15 | 16.7 | 12.76 | 14.08 | 16.16 | 15.57 | 15.57 | 15.57 | 15.57 | 15.57 |
| Capital Expenditure | -57.7 | -72.2 | -142.7 | -157.9 | -136.1 | -140.4 | -157.9 | -177.5 | -199.5 | -224.2 |
| Capital Expenditure, % | -10.01 | -9.08 | -17.21 | -18.49 | -15.26 | -14.01 | -14.01 | -14.01 | -14.01 | -14.01 |
| Tax Rate, % | 10.65 | 10.65 | 10.65 | 10.65 | 10.65 | 10.65 | 10.65 | 10.65 | 10.65 | 10.65 |
| EBITAT | 100.6 | 163.4 | 161.8 | 126.7 | 138.6 | 176.8 | 198.7 | 223.4 | 251.1 | 282.3 |
| Depreciation | ||||||||||
| Changes in Account Receivables | ||||||||||
| Changes in Inventories | ||||||||||
| Changes in Accounts Payable | ||||||||||
| Capital Expenditure | ||||||||||
| UFCF | -95.4 | 59.3 | -14.0 | -10.1 | 56.5 | 35.5 | 42.1 | 47.3 | 53.2 | 59.8 |
| WACC, % | 4.65 | 4.65 | 4.65 | 4.65 | 4.65 | 4.65 | 4.65 | 4.65 | 4.65 | 4.65 |
| PV UFCF | ||||||||||
| SUM PV UFCF | 205.6 | |||||||||
| Long Term Growth Rate, % | 3.50 | |||||||||
| Free cash flow (T + 1) | 62 | |||||||||
| Terminal Value | 5,381 | |||||||||
| Present Terminal Value | 4,288 | |||||||||
| Enterprise Value | 4,493 | |||||||||
| Net Debt | -711 | |||||||||
| Equity Value | 5,204 | |||||||||
| Diluted Shares Outstanding, MM | 112 | |||||||||
| Equity Value Per Share | 46.66 |
What You Will Receive
- Authentic Ningbo Yongxin Data: Comprehensive financial insights – encompassing revenue to EBIT – derived from actual and projected data.
- Complete Customization: Modify all key parameters (yellow cells) such as WACC, growth rates, and tax percentages.
- Real-Time Valuation Adjustments: Automatic recalculations to assess the influence of modifications on Ningbo Yongxin’s fair value.
- Flexible Excel Template: Designed for easy edits, scenario analysis, and in-depth forecasts.
- Efficient and Accurate: Avoid building models from the ground up while ensuring accuracy and adaptability.
Highlighted Features
- Authentic Financial Data: Gain access to reliable pre-loaded historical figures and future forecasts for Ningbo Yongxin Optics Co., Ltd (603297SS).
- Adjustable Forecast Parameters: Modify the yellow-highlighted cells to input your own assumptions such as WACC, growth rates, and profit margins.
- Interactive Calculations: Enjoy automatic updates to Discounted Cash Flow (DCF), Net Present Value (NPV), and cash flow analyses.
- Insightful Visual Dashboard: Utilize intuitive charts and summaries to effectively visualize your valuation outcomes.
- Designed for All Skill Levels: A user-friendly structure catered to investors, CFOs, and consultants alike.
How It Functions
- Step 1: Download the Excel file.
- Step 2: Examine the pre-filled financial data and projections for Ningbo Yongxin Optics Co., Ltd (603297SS).
- Step 3: Adjust key inputs such as revenue growth, WACC, and tax rates (highlighted cells).
- Step 4: Observe the DCF model refresh in real-time as you modify your assumptions.
- Step 5: Evaluate the outputs and leverage the findings for your investment strategies.
Why Choose This Calculator for Ningbo Yongxin Optics Co., Ltd (603297SS)?
- User-Friendly Design: Suitable for both novices and seasoned professionals.
- Customizable Inputs: Effortlessly adjust parameters to suit your analysis.
- Real-Time Feedback: Instantly visualize changes in Ningbo Yongxin's valuation as you modify inputs.
- Preloaded Financial Data: Comes equipped with Ningbo Yongxin’s actual financial metrics for swift evaluations.
- Professionally Endorsed: A go-to tool for investors and analysts for making well-informed decisions.
Who Can Benefit from This Product?
- Investors: Accurately determine the fair value of Ningbo Yongxin Optics Co., Ltd (603297SS) before making investment choices.
- CFOs: Utilize a professional-grade DCF model for comprehensive financial reporting and analysis.
- Consultants: Efficiently adapt the template for client valuation reports tailored to Ningbo Yongxin Optics Co., Ltd (603297SS).
- Entrepreneurs: Acquire insights into the financial modeling practices used by leading companies in the optics industry.
- Educators: Employ it as a teaching resource to illustrate various valuation methodologies.
Contents of the Template
- Pre-Filled DCF Model: Ningbo Yongxin Optics Co., Ltd’s financial data ready for immediate analysis.
- WACC Calculator: Comprehensive calculations for the Weighted Average Cost of Capital.
- Financial Ratios: Assess Ningbo Yongxin's profitability, leverage, and operational efficiency.
- Editable Inputs: Modify variables such as growth rates, margins, and CAPEX to align with your projections.
- Financial Statements: Annual and quarterly reports to facilitate in-depth review.
- Interactive Dashboard: Effortlessly visualize essential valuation metrics and outcomes.
Disclaimer
All information, articles, and product details provided on this website are for general informational and educational purposes only. We do not claim any ownership over, nor do we intend to infringe upon, any trademarks, copyrights, logos, brand names, or other intellectual property mentioned or depicted on this site. Such intellectual property remains the property of its respective owners, and any references here are made solely for identification or informational purposes, without implying any affiliation, endorsement, or partnership.
We make no representations or warranties, express or implied, regarding the accuracy, completeness, or suitability of any content or products presented. Nothing on this website should be construed as legal, tax, investment, financial, medical, or other professional advice. In addition, no part of this site—including articles or product references—constitutes a solicitation, recommendation, endorsement, advertisement, or offer to buy or sell any securities, franchises, or other financial instruments, particularly in jurisdictions where such activity would be unlawful.
All content is of a general nature and may not address the specific circumstances of any individual or entity. It is not a substitute for professional advice or services. Any actions you take based on the information provided here are strictly at your own risk. You accept full responsibility for any decisions or outcomes arising from your use of this website and agree to release us from any liability in connection with your use of, or reliance upon, the content or products found herein.