
|
Hengdian Group Tospo Lighting Co., Ltd. (603303.SS): BCG Matrix [Apr-2026 Updated] |
Fully Editable: Tailor To Your Needs In Excel Or Sheets
Professional Design: Trusted, Industry-Standard Templates
Investor-Approved Valuation Models
MAC/PC Compatible, Fully Unlocked
No Expertise Is Needed; Easy To Follow
Hengdian Group Tospo Lighting Co., Ltd. (603303.SS) Bundle
Tospo's portfolio is a tale of focused reinvestment: fast-growing Stars in automotive and smart lighting are driving R&D and heavy CAPEX, funded by stable Cash Cows in core LED sources and commercial luminaires, while Question Marks-integrated engineering projects and niche decorative lines-demand selective capital to prove scale, and Dogs like halogens and commoditized components are being wound down to free resources; understanding this mix reveals where management will place bets and why future value will hinge on converting select Question Marks into new Stars.
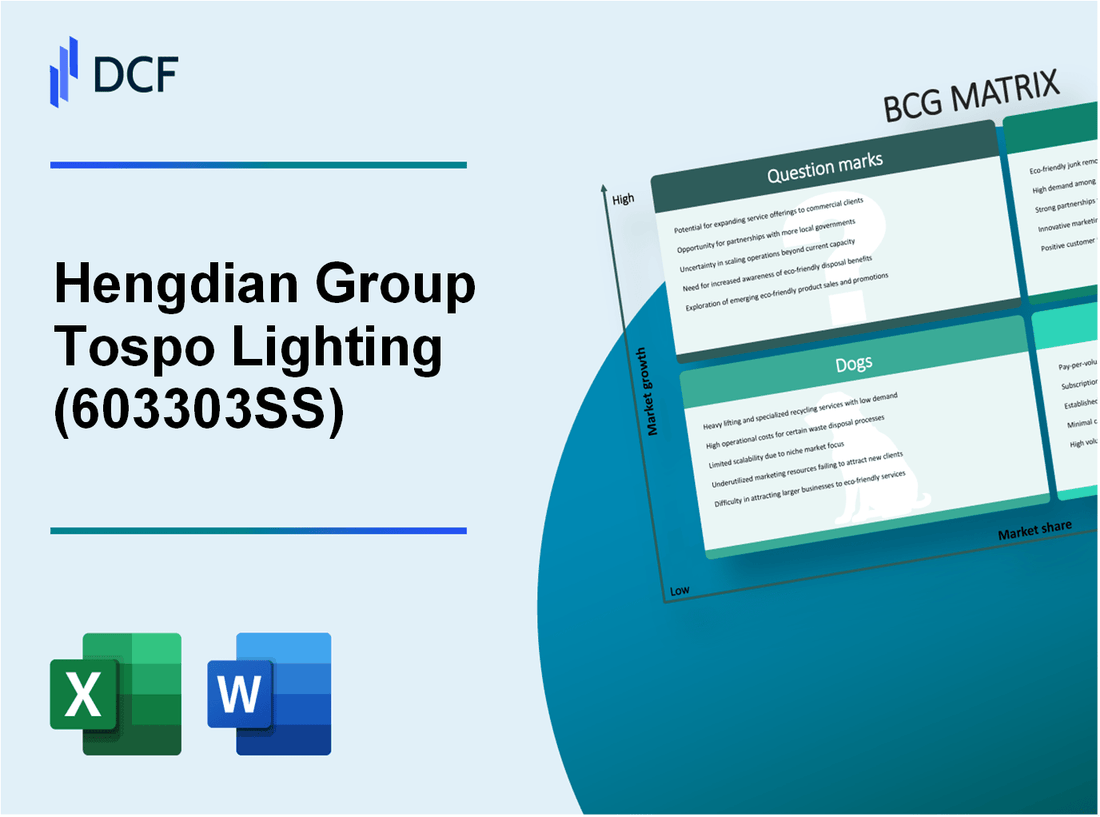
Hengdian Group Tospo Lighting Co., Ltd. (603303.SS) - BCG Matrix Analysis: Stars
Stars
Automotive lighting and electronics expansion continues to drive high growth for Tospo Lighting. The company has strategically pivoted toward the automotive sector, a market projected to grow at a CAGR of 6.8% through 2032, with global automotive lighting valuations cited at approximately $37 billion by 2025. Tospo's automotive segment recorded rapid revenue acceleration over the past three fiscal years, with reported segment revenue growth rates of ~28% CAGR (FY2022-FY2024) driven by rising EV penetration in China. China EV production is forecast to exceed 10 million units by 2025, creating strong OEM demand for advanced lighting systems. Tospo's R&D emphasis on adaptive LED systems, matrix headlights, and sensor-integrated modules positions it to capture an increasing share of the $17.8 billion automotive LED market. Compared with traditional luminaires, automotive lighting yields higher gross margins-Tospo's automotive gross margin is estimated at 22-26% versus 12-16% for conventional lighting-reflecting value-added electronics, software integration, and OEM certification premiums.
The company's commitment to this Star quadrant is evidenced by vertical integration across die/LED assembly, optics, thermal management, and control electronics, plus professional engineering qualifications (IATF 16949, automotive-grade EMC and IP ratings) that enable Tier-1/OEM supply. Key commercial indicators include multi-year supply contracts with domestic and select global OEMs, capital expenditures targeted at automated SMD/COB lines and LED test chambers, and R&D spend allocation of ~6-8% of segment revenue toward adaptive optics and algorithm development.
| Metric | Automotive Lighting Segment | Company Aggregate / Notes |
|---|---|---|
| Market CAGR (target segment) | 6.8% (through 2032) | Automotive LED ~$17.8B market |
| Projected Market Value (2025) | $37.0B (automotive lighting) | Global LED & intelligent lighting growth supportive |
| Tospo Automotive Revenue Growth | ~28% CAGR (FY2022-FY2024) | Outpacing company-wide growth |
| Segment Gross Margin | 22-26% | Higher than traditional lighting (12-16%) |
| R&D Spend (segment) | ~6-8% of automotive revenue | Focus: adaptive LEDs, matrix control, sensor integration |
| China EV Production Forecast | >10 million units by 2025 | Primary demand driver for advanced lighting |
| Vertical Integration Coverage | Die → PCB → Optics → Module → Software | Supports cost control and quality for OEMs |
Smart lighting systems represent a parallel Star: a high-growth frontier requiring significant capital and software investment. The global smart lighting market is estimated to expand from $18.0 billion in 2025 to $45.64 billion by 2029, implying a 20.8% CAGR. Tospo has integrated IoT and AI across products-smart ceilings, downlights, AmbiColour fixtures-targeting both residential and commercial channels. The firm's smart portfolio utilizes wireless protocols (Zigbee, BLE, Wi‑Fi) and middleware for cloud and local control, aligning with a connected infrastructure growth requirement of ~18.5% annually for smart buildings. The software and services component of smart lighting is growing at ~17.4% annually, increasing recurring revenue potential via firmware, cloud subscriptions, and BMS integrations.
Tospo's smart lighting business benefits from energy-efficiency positioning (lumens-per-watt improvements of 10-25% versus incumbent products), certifications (Zhaga, DALI-2 compliance, energy star/China energy labels), and partnerships with smart-city integrators. Capital allocation includes investments in manufacturing flexibility for mixed-electronics assemblies, test automation for wireless modules, and productization teams to accelerate time-to-market for software-enabled fixtures.
| Metric | Smart Lighting Segment | Company Impact / Notes |
|---|---|---|
| Market Size (2025) | $18.0B | Baseline for smart portfolio scaling |
| Market Size (2029) | $45.64B | Implied CAGR 20.8% |
| Connected Infrastructure Growth | ~18.5% annually | Demand driver for Zigbee/BLE solutions |
| Software Component Growth | ~17.4% annually | Recurring revenue opportunity |
| Product Energy Efficiency Gain | +10-25% lumens/W versus legacy | Supports green building and rebate programs |
| R&D & Capex Focus | IoT stacks, cloud platforms, test automation | Enables integration with smart city/BMS projects |
- Strategic focus: maintain leading-edge product roadmap in adaptive/matrix headlights and AI-enabled smart luminaires to sustain high relative market share.
- Investment priorities: expand automated manufacturing for mixed-signal assemblies; increase R&D headcount for algorithms, sensor fusion, and cybersecurity for lighting systems.
- Commercial initiatives: lock multi-year supply agreements with OEMs, embed software licensing and cloud services to move revenue mix toward higher-margin recurring streams.
- Risk mitigation: diversify wireless stacks and certify across multiple regional standards to reduce single-protocol dependency and accelerate international deployment.
Hengdian Group Tospo Lighting Co., Ltd. (603303.SS) - BCG Matrix Analysis: Cash Cows
Cash Cows
LED light source products remain the primary revenue generator with stable market dominance. As of late 2025, LED lighting accounts for over 58% of the global lighting market share, providing a steady stream of cash for Tospo's diversified operations. Tospo's LED segment contributes the majority of consolidated revenue, supporting a trailing twelve-month (TTM) revenue of approximately 4.43 billion CNY despite a quarter-over-quarter revenue dip of 1.21% in Q3 2025. The global LED market valuation relevant to Tospo's operations is estimated at $102.5 billion in 2025, with Tospo maintaining established distribution channels across 70+ countries and high brand recognition reflected in placement among Asia's 500 Most Influential Brands.
The LED segment operates with optimized manufacturing costs and established economies of scale, delivering stable gross margins and predictable free cash flow used to fund higher-capex divisions such as automotive lighting and smart lighting. Key operational and financial metrics for the LED cash cow are summarized below.
| Metric | Value | Notes |
|---|---|---|
| TTM Revenue (LED) | ~4.43 billion CNY | Company consolidated, trailing 12 months to 30 Sep 2025 |
| Quarterly Revenue Change (Q3 2025) | -1.21% | Seasonal and macro fluctuations |
| Global LED Market Share (by value) | 58% of global lighting market | Global lighting market segmentation, 2025 |
| Global LED Market Size (2025) | $102.5 billion | Industry estimate relevant to Tospo TAM |
| Geographic Reach | 70+ countries | Distribution and channels |
| Brand Recognition | Asia's 500 Most Influential Brands | Third-party recognition impacting loyalty |
| Gross Margin (LED segment) | Estimated 22-26% | Optimized manufacturing and scale |
| Free Cash Flow Contribution | Majority of corporate FCF | Funds capex-intensive divisions |
Professional and commercial luminaires provide consistent returns through large-scale infrastructure projects. The professional indoor lighting segment represents nearly 50% of the total lighting market by application, where Tospo serves a diverse customer base approaching 1,000 clients including office, retail, hospitality, and industrial accounts. With the global lighting market valued at $158 billion in 2025, Tospo's professional luminaires deliver reliable ROI underpinned by mass retrofit programs and new construction demand driven by global energy-efficiency regulations.
These luminaires benefit from long replacement cycles, strong order-backlog visibility from infrastructure projects, and established footprints in North America and Europe that together account for over 20% of global lighting consumption. The mature lifecycle and predictable margin profile of the luminaires segment allow Tospo to maintain a TTM net profit margin of 7.84% at the consolidated level, with the professional segment contributing a significant portion of operating profit.
| Metric | Value | Notes |
|---|---|---|
| Professional Indoor Lighting Market Share (Application) | ~50% | By application within total lighting market |
| Global Lighting Market Size (2025) | $158 billion | Overall market valuation |
| Customer Base | ~1,000 clients | Large-scale and repeat project clients |
| Regional Exposure | North America & Europe >20% consumption | Market diversification reduces regional risk |
| TTM Net Profit Margin (Consolidated) | 7.84% | Includes professional luminaires contribution |
| Segment EBITDA Margin | ~10-14% | Mature product lines and project pricing |
| Order Backlog | Multi-quarter visibility | Infrastructure and retrofit project pipelines |
Cash allocation and operational implications:
- Primary cash generation: LED light source products funding corporate R&D and capex for automotive & smart lighting.
- Stable project cash flow: Professional luminaires provide predictable receivables from long-term contracts and public tenders.
- Margin management: Continued focus on manufacturing efficiency and channel optimization to sustain 22-26% gross margins for LED and 10-14% EBITDA for luminaires.
- Capital deployment: Free cash flow prioritized for strategic investments (automotive LED R&D, IoT integration) and selective M&A to expand overseas commercial footprint.
Hengdian Group Tospo Lighting Co., Ltd. (603303.SS) - BCG Matrix Analysis: Question Marks
Question Marks - Integrated lighting engineering projects face high market potential but intense competition. The global lighting market is projected to reach $260.48 billion by 2034, with the design-and-installation professional engineering segment exhibiting above-average growth (estimated CAGR 8-12% in Asia-Pacific smart-city and infrastructure projects). Tospo is actively exploring professional engineering development paths; however, this subsector is highly fragmented with over 86,900 competing companies globally in specialized lighting services and contracting. Tospo's relative market share in large-scale international engineering is currently low (estimated <2% in APAC commercial engineering tenders where it has recently participated), placing these businesses in the Question Marks quadrant.
| Metric | Value / Estimate |
|---|---|
| Global lighting market size (2034) | $260.48 billion |
| Professional engineering segment CAGR (APAC) | 8-12% |
| Number of competing specialized lighting firms (global) | ~86,900 |
| Tospo estimated relative market share (large-scale engineering) | <2% |
| Current CAPEX allocated to engineering qualification & certifications (FY most recent) | ¥120-200 million (approx.) |
| Target contract size for profitability (per project) | ¥8-25 million |
Key operational and financial challenges for converting Integrated Projects from Question Marks to Stars include high upfront CAPEX for project management systems, specialized labor recruitment, international compliance and certification costs, longer working capital cycles, and bid-to-win ratios constrained by local incumbents. Tospo's current strategy channels CAPEX into professional qualification: certification programs, strategic hires (lighting designers, project managers), BIM and lighting simulation platforms, and partnerships with regional EPC firms to improve win rates for smart city tenders.
- Primary CAPEX allocations: ¥120-200M towards certifications, BIM, and pilot projects
- Operational priorities: reduce bid cycle time, improve project gross margins to target 12-18%
- Revenue sensitivity: successful conversion of 2-4 large contracts/year could raise segment revenue share from <5% to 12-18% within 3 years
Question Marks - Specialty and decorative lighting products occupy a niche with volatile consumer demand. The residential market accounts for 42.9% of total LED demand globally; within this, specialty decorative bulbs and filament lamps target high-end aesthetic segments that command premium pricing but are highly trend-sensitive. Tospo's R&D focus on human-centric lighting (HCL) and tunable LED systems aligns with the market for advanced lighting solutions projected at an 11.5% CAGR. Despite R&D investments, current revenue from specialty decorative lines is relatively small (estimated 6-9% of total revenue), with gross margins that can be attractive (20-35%) when product mix and pricing are optimized but vulnerable to margin compression from low-cost competitors.
| Metric | Value / Estimate |
|---|---|
| Residential share of LED market | 42.9% |
| Projected CAGR for advanced lighting solutions (HCL, tunable) | 11.5% |
| Tospo revenue contribution from specialty lines | 6-9% of consolidated revenue |
| Typical gross margin range (specialty decorative) | 20-35% |
| Market volatility drivers | Design trends, seasonality, price competition from low-cost producers |
Strategic choices for Tospo in this niche require balancing increased marketing and brand-building investment versus maintaining a contained, high-margin specialist offering. Scaling the specialty portfolio via marketing, channel partnerships, and targeted e-commerce could grow revenue share but would require incremental OPEX (estimated marketing uplift 0.8-1.5% of revenue annually) and inventory risks. Maintaining a limited presence preserves margins but may forfeit long-term positioning in HCL and tunable lighting segments expected to outpace the core LED source business growth.
- Options: increase marketing spend to build brand equity (projected incremental OPEX ¥30-70M/year) or retain low-cost, low-investment niche strategy
- KPIs to monitor: specialty revenue growth rate, gross margin %, SKU turnover, brand sentiment index, share of sales from HCL/tunable products
- Decision trigger: specialty revenue >12% or sustained double-digit YoY growth in HCL sales to justify scale-up
Hengdian Group Tospo Lighting Co., Ltd. (603303.SS) - BCG Matrix Analysis: Dogs
Question Marks - Dogs: Traditional halogen and incandescent lighting products are rapid-decline legacy SKUs for Tospo. Global LED penetration reached approximately 62% of unit shipments and 78% of value by 2025, pushing halogen/incandescent annual volume down by an estimated 18-22% CAGR since 2020. Regulatory action (EU Ecodesign, US energy-efficiency mandates, China phasing timelines) has accelerated write-downs; Tospo's internal product portfolio shows a reduction of legacy-product revenue from 13.4% of total sales in 2019 to 3.1% in FY2024. Gross margin on these lines has fallen below 6%, compared with corporate average gross margin of 27.5% in FY2024.
Maintaining remaining inventory and any production capacity yields negative opportunity cost: unit inventory turnover for these SKUs was 1.2x annually in 2024 versus 6.8x for LED luminaires. Capital expenditure allocated to legacy line maintenance was reduced from RMB 45.6 million in 2018 to RMB 4.2 million in 2024. Production headcount tied to legacy lines decreased by 61% over the same period, reflecting strategic redeployment toward LEDs and intelligent lighting systems.
| Metric | Halogen/Incandescent (Legacy) | LED & Smart Luminaires |
|---|---|---|
| Share of Company Revenue (2019) | 13.4% | 58.7% |
| Share of Company Revenue (2024) | 3.1% | 78.9% |
| Gross Margin (FY2024) | 5.8% | 31.2% |
| Inventory Turnover (2024) | 1.2x | 6.8x |
| CapEx Allocated (2024) | RMB 4.2M | RMB 382.7M |
| Headcount Change (2018-2024) | -61% | +27% |
Question Marks - Dogs: Low-margin structural components and basic lighting accessories have become commoditized. Market dynamics show downward price pressure: average selling price (ASP) decline of 9.5% CAGR for basic components from 2019-2024, with Tospo reporting a negative cost-of-revenue growth of -7.18% annually for commodity parts. These include unbranded engineering plastics, standard die-cast housings, screws, and basic driver boards sold as separate SKUs. Unit-level gross profit for components sold externally averaged 2.3% in FY2024.
Tospo's strategic shift toward integrated, smart luminaires reduces external demand for separate components: the proportion of component revenue sold to third parties declined from 41% in 2019 to 12% in 2024. Internal consumption still requires these parts for vertical integration, but their standalone economics are weak and often subsidized internally to preserve supply-chain continuity for higher-margin finished goods.
- Commodity components ASP change (2019-2024): -9.5% CAGR
- Company cost-of-revenue growth for basic parts (annual): -7.18%
- Standalone component gross profit (FY2024): 2.3%
- Third-party component sales as % of component revenue (2019): 41%
- Third-party component sales as % of component revenue (2024): 12%
| Component Type | ASP Change (2019-2024) | Standalone Gross Profit (FY2024) | Third-Party Sales Share (2019) | Third-Party Sales Share (2024) |
|---|---|---|---|---|
| Engineering plastics (unbranded) | -8.4% CAGR | 1.8% | 38% | 10% |
| Basic die-cast housings | -10.1% CAGR | 2.6% | 44% | 14% |
| Standard drivers (non-smart) | -7.2% CAGR | 2.9% | 41% | 13% |
| Fasteners & small parts | -11.0% CAGR | 1.5% | 36% | 9% |
Operationally, Tospo retains minimal external sales channels for commoditized parts, instead using them to secure lead times and quality control for finished smart products. The company's FY2024 annual report emphasizes 'value-added integrated solutions' and R&D investments (RMB 152.4M in FY2024, +18% YoY) directed away from commodity parts and toward optics, driver integration, IoT modules, and thermal management-areas with targeted gross margins above 28%.
Disclaimer
All information, articles, and product details provided on this website are for general informational and educational purposes only. We do not claim any ownership over, nor do we intend to infringe upon, any trademarks, copyrights, logos, brand names, or other intellectual property mentioned or depicted on this site. Such intellectual property remains the property of its respective owners, and any references here are made solely for identification or informational purposes, without implying any affiliation, endorsement, or partnership.
We make no representations or warranties, express or implied, regarding the accuracy, completeness, or suitability of any content or products presented. Nothing on this website should be construed as legal, tax, investment, financial, medical, or other professional advice. In addition, no part of this site—including articles or product references—constitutes a solicitation, recommendation, endorsement, advertisement, or offer to buy or sell any securities, franchises, or other financial instruments, particularly in jurisdictions where such activity would be unlawful.
All content is of a general nature and may not address the specific circumstances of any individual or entity. It is not a substitute for professional advice or services. Any actions you take based on the information provided here are strictly at your own risk. You accept full responsibility for any decisions or outcomes arising from your use of this website and agree to release us from any liability in connection with your use of, or reliance upon, the content or products found herein.