
|
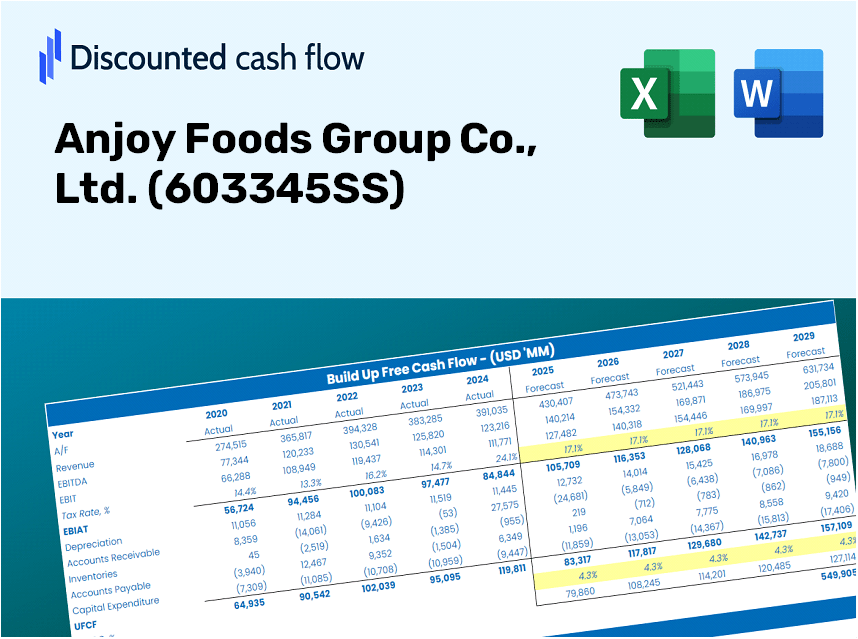
Anjoy Foods Group Co., Ltd. (603345.SS) DCF Valuation |
Fully Editable: Tailor To Your Needs In Excel Or Sheets
Professional Design: Trusted, Industry-Standard Templates
Investor-Approved Valuation Models
MAC/PC Compatible, Fully Unlocked
No Expertise Is Needed; Easy To Follow
Anjoy Foods Group Co., Ltd. (603345.SS) Bundle
Enhance your investment strategy with the (603345SS) DCF Calculator! Dive into the actual financials of Anjoy Foods Group Co., Ltd., adjust growth predictions and expenses, and instantly observe how these modifications affect the intrinsic value of (603345SS).
What You Will Receive
- Authentic Anjoy Data: Comprehensive financials – encompassing revenue to EBIT – derived from both actual and anticipated figures.
- Complete Customization: Modify all key variables (yellow cells) such as WACC, growth %, and tax rates.
- Immediate Valuation Updates: Automatic recalculations to assess the effects of changes on Anjoy's fair value.
- Flexible Excel Template: Designed for quick modifications, scenario analysis, and detailed forecasting.
- Efficient and Precise: Eliminate the need to construct models from the ground up while ensuring accuracy and adaptability.
Key Features
- Customizable Growth Inputs: Adjust vital parameters such as revenue growth, EBITDA margin, and capital investments.
- Instant DCF Valuation: Automatically computes intrinsic value, NPV, and other key metrics in real-time.
- High-Precision Accuracy: Utilizes Anjoy Foods Group's actual financial data for dependable valuation results.
- Simplified Scenario Analysis: Effortlessly analyze various assumptions and assess different outcomes.
- Efficiency Booster: Avoid the complexities of building detailed valuation models from the ground up.
How It Operates
- 1. Access the Template: Download and open the Excel file featuring Anjoy Foods Group Co., Ltd. (603345SS) preloaded data.
- 2. Adjust Assumptions: Modify essential inputs such as growth rates, WACC, and capital expenditures.
- 3. View Immediate Results: The DCF model automatically calculates intrinsic value and NPV for you.
- 4. Explore Scenarios: Evaluate various forecasts to assess different valuation results.
- 5. Use with Assurance: Present expert valuation insights to reinforce your decision-making process.
Why Choose Anjoy Foods Group Co., Ltd. (603345SS)?
- User-Friendly Interface: Tailored for both novices and seasoned professionals.
- Customizable Parameters: Adjust inputs effortlessly to suit your analysis needs.
- Real-Time Insights: Observe live updates on Anjoy Foods' valuation as you modify inputs.
- Pre-Loaded Data: Comes with Anjoy Foods' actual financial information for swift assessments.
- Preferred by Experts: Utilized by analysts and investors for strategic decision-making.
Who Should Benefit from Anjoy Foods Group Co., Ltd. (603345SS)?
- Food Industry Students: Explore valuation methodologies and apply them using real market data.
- Researchers: Integrate professional financial models into your academic projects or studies.
- Investors: Validate your investment hypotheses and evaluate the valuation metrics for Anjoy Foods Group Co., Ltd. (603345SS).
- Financial Analysts: Enhance your analysis process with a customizable DCF model designed specifically for the food sector.
- Entrepreneurs: Understand how public companies like Anjoy Foods Group Co., Ltd. (603345SS) are assessed in the market.
Overview of the Template's Features
- Pre-Filled DCF Model: Anjoy Foods Group Co., Ltd.'s (603345SS) financial data integrated for instant application.
- WACC Calculator: Comprehensive calculations for the Weighted Average Cost of Capital.
- Financial Ratios: Analyze Anjoy Foods' profitability, leverage, and operational efficiency.
- Editable Inputs: Modify parameters such as growth rates, profit margins, and CAPEX to suit your analysis.
- Financial Statements: Access annual and quarterly reports for in-depth evaluation.
- Interactive Dashboard: Effortlessly visualize essential valuation metrics and outcomes.
Disclaimer
All information, articles, and product details provided on this website are for general informational and educational purposes only. We do not claim any ownership over, nor do we intend to infringe upon, any trademarks, copyrights, logos, brand names, or other intellectual property mentioned or depicted on this site. Such intellectual property remains the property of its respective owners, and any references here are made solely for identification or informational purposes, without implying any affiliation, endorsement, or partnership.
We make no representations or warranties, express or implied, regarding the accuracy, completeness, or suitability of any content or products presented. Nothing on this website should be construed as legal, tax, investment, financial, medical, or other professional advice. In addition, no part of this site—including articles or product references—constitutes a solicitation, recommendation, endorsement, advertisement, or offer to buy or sell any securities, franchises, or other financial instruments, particularly in jurisdictions where such activity would be unlawful.
All content is of a general nature and may not address the specific circumstances of any individual or entity. It is not a substitute for professional advice or services. Any actions you take based on the information provided here are strictly at your own risk. You accept full responsibility for any decisions or outcomes arising from your use of this website and agree to release us from any liability in connection with your use of, or reliance upon, the content or products found herein.