
|
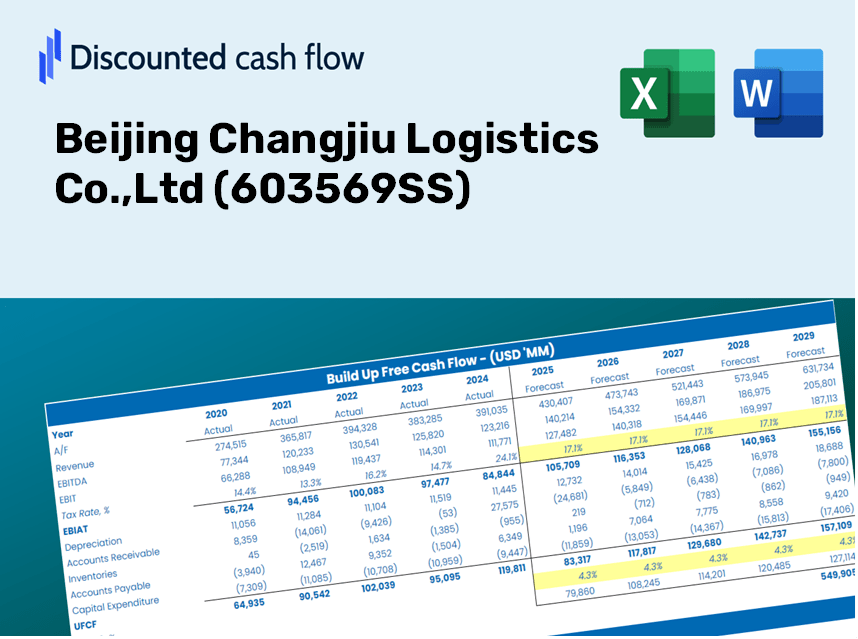
Beijing Changjiu Logistics Co.,Ltd (603569.SS) DCF Valuation |
Fully Editable: Tailor To Your Needs In Excel Or Sheets
Professional Design: Trusted, Industry-Standard Templates
Investor-Approved Valuation Models
MAC/PC Compatible, Fully Unlocked
No Expertise Is Needed; Easy To Follow
Beijing Changjiu Logistics Co.,Ltd (603569.SS) Bundle
Simplify Beijing Changjiu Logistics Co.,Ltd (603569SS) valuation with this customizable DCF Calculator! Featuring real Beijing Changjiu Logistics Co.,Ltd (603569SS) financials and adjustable forecast inputs, you can test scenarios and uncover Beijing Changjiu Logistics Co.,Ltd (603569SS) fair value in minutes.
Discounted Cash Flow (DCF) - (USD MM)
| Year | AY1 2020 |
AY2 2021 |
AY3 2022 |
AY4 2023 |
AY5 2024 |
FY1 2025 |
FY2 2026 |
FY3 2027 |
FY4 2028 |
FY5 2029 |
|---|---|---|---|---|---|---|---|---|---|---|
| Revenue | 4,077.2 | 4,486.5 | 3,957.6 | 3,783.0 | 4,174.9 | 4,218.7 | 4,263.0 | 4,307.7 | 4,352.9 | 4,398.6 |
| Revenue Growth, % | 0 | 10.04 | -11.79 | -4.41 | 10.36 | 1.05 | 1.05 | 1.05 | 1.05 | 1.05 |
| EBITDA | 417.6 | 398.6 | 285.3 | 319.1 | 489.8 | 392.4 | 396.5 | 400.6 | 404.8 | 409.1 |
| EBITDA, % | 10.24 | 8.88 | 7.21 | 8.44 | 11.73 | 9.3 | 9.3 | 9.3 | 9.3 | 9.3 |
| Depreciation | 177.6 | 204.0 | 209.3 | 227.1 | 297.3 | 230.5 | 232.9 | 235.3 | 237.8 | 240.3 |
| Depreciation, % | 4.36 | 4.55 | 5.29 | 6 | 7.12 | 5.46 | 5.46 | 5.46 | 5.46 | 5.46 |
| EBIT | 240.0 | 194.5 | 76.0 | 92.0 | 192.5 | 161.9 | 163.6 | 165.3 | 167.0 | 168.8 |
| EBIT, % | 5.89 | 4.34 | 1.92 | 2.43 | 4.61 | 3.84 | 3.84 | 3.84 | 3.84 | 3.84 |
| Total Cash | 949.5 | 839.0 | 612.9 | 609.3 | 636.0 | 749.4 | 757.2 | 765.2 | 773.2 | 781.3 |
| Total Cash, percent | .0 | .0 | .0 | .0 | .0 | .0 | .0 | .0 | .0 | .0 |
| Account Receivables | 1,539.8 | 1,592.9 | 1,664.8 | 1,565.8 | 1,616.2 | 1,649.0 | 1,666.3 | 1,683.8 | 1,701.5 | 1,719.3 |
| Account Receivables, % | 37.77 | 35.5 | 42.07 | 41.39 | 38.71 | 39.09 | 39.09 | 39.09 | 39.09 | 39.09 |
| Inventories | 4.6 | 10.9 | 57.0 | 112.2 | 136.2 | 67.7 | 68.4 | 69.1 | 69.9 | 70.6 |
| Inventories, % | 0.11181 | 0.24351 | 1.44 | 2.97 | 3.26 | 1.61 | 1.61 | 1.61 | 1.61 | 1.61 |
| Accounts Payable | 738.3 | 786.8 | 560.3 | 543.0 | 675.7 | 677.9 | 685.0 | 692.2 | 699.4 | 706.8 |
| Accounts Payable, % | 18.11 | 17.54 | 14.16 | 14.35 | 16.18 | 16.07 | 16.07 | 16.07 | 16.07 | 16.07 |
| Capital Expenditure | -146.1 | -129.8 | -93.8 | -196.0 | -157.4 | -150.2 | -151.7 | -153.3 | -154.9 | -156.6 |
| Capital Expenditure, % | -3.58 | -2.89 | -2.37 | -5.18 | -3.77 | -3.56 | -3.56 | -3.56 | -3.56 | -3.56 |
| Tax Rate, % | 21.59 | 21.59 | 21.59 | 21.59 | 21.59 | 21.59 | 21.59 | 21.59 | 21.59 | 21.59 |
| EBITAT | 181.6 | 133.1 | 142.8 | 97.6 | 150.9 | 136.8 | 138.2 | 139.7 | 141.2 | 142.6 |
| Depreciation | ||||||||||
| Changes in Account Receivables | ||||||||||
| Changes in Inventories | ||||||||||
| Changes in Accounts Payable | ||||||||||
| Capital Expenditure | ||||||||||
| UFCF | -592.9 | 196.4 | -86.2 | 155.2 | 349.1 | 255.0 | 208.5 | 210.7 | 212.9 | 215.1 |
| WACC, % | 6.16 | 6.02 | 6.62 | 6.62 | 6.21 | 6.33 | 6.33 | 6.33 | 6.33 | 6.33 |
| PV UFCF | ||||||||||
| SUM PV UFCF | 924.4 | |||||||||
| Long Term Growth Rate, % | 4.00 | |||||||||
| Free cash flow (T + 1) | 224 | |||||||||
| Terminal Value | 9,613 | |||||||||
| Present Terminal Value | 7,074 | |||||||||
| Enterprise Value | 7,998 | |||||||||
| Net Debt | 444 | |||||||||
| Equity Value | 7,554 | |||||||||
| Diluted Shares Outstanding, MM | 442 | |||||||||
| Equity Value Per Share | 17.09 |
Benefits You Will Receive
- Accurate BC Logistics Financials: Access to historical and projected data for precise valuation.
- Customizable Inputs: Adjust WACC, tax rates, revenue growth, and capital expenditures as needed.
- Dynamic Calculations: Intrinsic value and NPV are computed automatically.
- Scenario Testing: Evaluate various scenarios to assess the future performance of Beijing Changjiu Logistics (603569SS).
- User-Friendly Interface: Designed for professionals while remaining easy to navigate for newcomers.
Core Attributes
- Authentic Financial Data: Gain access to precise historical records and future forecasts for Beijing Changjiu Logistics Co., Ltd (603569SS).
- Adjustable Forecast Parameters: Modify highlighted fields related to WACC, growth rates, and profit margins easily.
- Real-Time Calculations: Enjoy automatic updates for DCF, Net Present Value (NPV), and cash flow assessments.
- Interactive Visualization Dashboard: Utilize user-friendly graphs and summaries to better understand your valuation findings.
- Designed for All Experience Levels: A straightforward and intuitive setup catering to investors, CFOs, and consultants alike.
How It Functions
- Step 1: Download the Excel file.
- Step 2: Examine the pre-filled Beijing Changjiu Logistics data (historical and projected).
- Step 3: Modify key assumptions (highlighted in yellow) according to your analysis.
- Step 4: Observe the automatic recalculations for the intrinsic value of Beijing Changjiu Logistics Co., Ltd (603569SS).
- Step 5: Utilize the results for investment strategies or reporting purposes.
Why Choose Beijing Changjiu Logistics Co., Ltd (603569SS)?
- Precision: Leverage accurate logistics data for reliable decision-making.
- Versatility: Tailored for users to easily experiment and adjust parameters.
- Efficiency: Eliminate the need to create logistics models from the ground up.
- Expert-Level: Crafted with insight and usability that meets industry standards.
- Intuitive: Designed for simplicity, accessible even to those new to logistics analysis.
Who Can Benefit from This Service?
- Logistics Managers: Develop comprehensive strategies for optimizing supply chain operations.
- Corporate Executives: Assess logistical scenarios to inform company-wide decisions.
- Consultants and Analysts: Deliver precise logistical insights for clients in the industry.
- Students and Instructors: Utilize real-world logistics data for practical learning and teaching.
- Industry Enthusiasts: Gain insights into how logistics companies like Beijing Changjiu Logistics Co., Ltd (603569SS) operate and are evaluated in the market.
What the Template Includes
- Pre-Filled Data: Features Beijing Changjiu Logistics Co., Ltd's historical financials and projected figures.
- Discounted Cash Flow Model: An editable DCF valuation model with automatic computation capabilities.
- Weighted Average Cost of Capital (WACC): A dedicated sheet to calculate WACC using tailored inputs.
- Key Financial Ratios: Assess the profitability, efficiency, and leverage of Beijing Changjiu Logistics Co., Ltd.
- Customizable Inputs: Easily modify revenue growth, margins, and tax rates.
- Clear Dashboard: Visual representations and tables summarizing the key valuation outcomes.
Disclaimer
All information, articles, and product details provided on this website are for general informational and educational purposes only. We do not claim any ownership over, nor do we intend to infringe upon, any trademarks, copyrights, logos, brand names, or other intellectual property mentioned or depicted on this site. Such intellectual property remains the property of its respective owners, and any references here are made solely for identification or informational purposes, without implying any affiliation, endorsement, or partnership.
We make no representations or warranties, express or implied, regarding the accuracy, completeness, or suitability of any content or products presented. Nothing on this website should be construed as legal, tax, investment, financial, medical, or other professional advice. In addition, no part of this site—including articles or product references—constitutes a solicitation, recommendation, endorsement, advertisement, or offer to buy or sell any securities, franchises, or other financial instruments, particularly in jurisdictions where such activity would be unlawful.
All content is of a general nature and may not address the specific circumstances of any individual or entity. It is not a substitute for professional advice or services. Any actions you take based on the information provided here are strictly at your own risk. You accept full responsibility for any decisions or outcomes arising from your use of this website and agree to release us from any liability in connection with your use of, or reliance upon, the content or products found herein.