
|
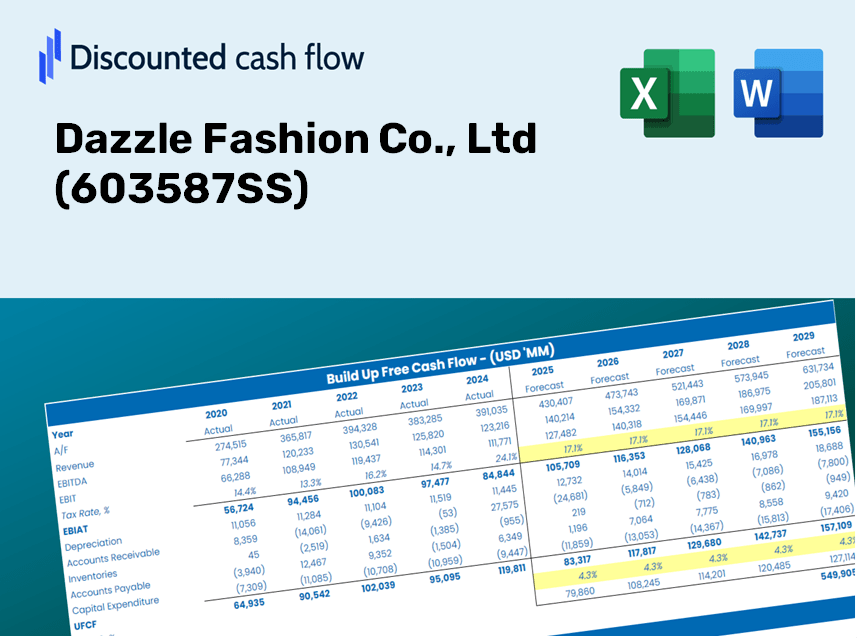
Dazzle Fashion Co., Ltd (603587.SS) DCF Valuation |
Fully Editable: Tailor To Your Needs In Excel Or Sheets
Professional Design: Trusted, Industry-Standard Templates
Investor-Approved Valuation Models
MAC/PC Compatible, Fully Unlocked
No Expertise Is Needed; Easy To Follow
Dazzle Fashion Co., Ltd (603587.SS) Bundle
Discover the true potential of Dazzle Fashion Co., Ltd (603587SS) with our advanced DCF Calculator! Adjust essential assumptions, explore various scenarios, and evaluate how different changes influence the valuation of Dazzle Fashion Co., Ltd (603587SS) – all within one convenient Excel template.
Discounted Cash Flow (DCF) - (USD MM)
| Year | AY1 2020 |
AY2 2021 |
AY3 2022 |
AY4 2023 |
AY5 2024 |
FY1 2025 |
FY2 2026 |
FY3 2027 |
FY4 2028 |
FY5 2029 |
|---|---|---|---|---|---|---|---|---|---|---|
| Revenue | 2,564.2 | 2,897.6 | 2,400.4 | 2,648.8 | 2,218.8 | 2,163.1 | 2,108.8 | 2,055.9 | 2,004.3 | 1,954.0 |
| Revenue Growth, % | 0 | 13 | -17.16 | 10.35 | -16.23 | -2.51 | -2.51 | -2.51 | -2.51 | -2.51 |
| EBITDA | 934.3 | 1,124.3 | 743.1 | 878.6 | 570.3 | 714.1 | 696.2 | 678.7 | 661.7 | 645.1 |
| EBITDA, % | 36.43 | 38.8 | 30.96 | 33.17 | 25.7 | 33.01 | 33.01 | 33.01 | 33.01 | 33.01 |
| Depreciation | 76.0 | 197.3 | 229.7 | 198.2 | 158.5 | 147.0 | 143.3 | 139.7 | 136.2 | 132.8 |
| Depreciation, % | 2.97 | 6.81 | 9.57 | 7.48 | 7.15 | 6.79 | 6.79 | 6.79 | 6.79 | 6.79 |
| EBIT | 858.2 | 926.9 | 513.4 | 680.4 | 411.8 | 567.1 | 552.9 | 539.0 | 525.5 | 512.3 |
| EBIT, % | 33.47 | 31.99 | 21.39 | 25.69 | 18.56 | 26.22 | 26.22 | 26.22 | 26.22 | 26.22 |
| Total Cash | 2,853.1 | 3,245.6 | 2,941.9 | 3,107.8 | 2,961.7 | 2,163.1 | 2,108.8 | 2,055.9 | 2,004.3 | 1,954.0 |
| Total Cash, percent | .0 | .0 | .0 | .0 | .0 | .0 | .0 | .0 | .0 | .0 |
| Account Receivables | 145.7 | 61.0 | 64.3 | 162.3 | 138.8 | 98.9 | 96.4 | 94.0 | 91.6 | 89.3 |
| Account Receivables, % | 5.68 | 2.11 | 2.68 | 6.13 | 6.26 | 4.57 | 4.57 | 4.57 | 4.57 | 4.57 |
| Inventories | 309.9 | 323.3 | 377.5 | 387.9 | 420.0 | 313.9 | 306.0 | 298.3 | 290.8 | 283.5 |
| Inventories, % | 12.08 | 11.16 | 15.73 | 14.64 | 18.93 | 14.51 | 14.51 | 14.51 | 14.51 | 14.51 |
| Accounts Payable | 104.3 | 103.0 | 90.6 | 63.5 | 75.4 | 74.4 | 72.5 | 70.7 | 68.9 | 67.2 |
| Accounts Payable, % | 4.07 | 3.55 | 3.77 | 2.4 | 3.4 | 3.44 | 3.44 | 3.44 | 3.44 | 3.44 |
| Capital Expenditure | -54.0 | -41.0 | -29.3 | -48.9 | -51.2 | -38.5 | -37.5 | -36.6 | -35.7 | -34.8 |
| Capital Expenditure, % | -2.11 | -1.42 | -1.22 | -1.85 | -2.31 | -1.78 | -1.78 | -1.78 | -1.78 | -1.78 |
| Tax Rate, % | 24.81 | 24.81 | 24.81 | 24.81 | 24.81 | 24.81 | 24.81 | 24.81 | 24.81 | 24.81 |
| EBITAT | 635.4 | 702.0 | 396.3 | 504.3 | 309.6 | 426.8 | 416.1 | 405.6 | 395.5 | 385.5 |
| Depreciation | ||||||||||
| Changes in Account Receivables | ||||||||||
| Changes in Inventories | ||||||||||
| Changes in Accounts Payable | ||||||||||
| Capital Expenditure | ||||||||||
| UFCF | 306.2 | 928.1 | 526.9 | 518.1 | 420.2 | 680.4 | 530.3 | 517.0 | 504.1 | 491.4 |
| WACC, % | 5.09 | 5.09 | 5.1 | 5.09 | 5.09 | 5.09 | 5.09 | 5.09 | 5.09 | 5.09 |
| PV UFCF | ||||||||||
| SUM PV UFCF | 2,369.6 | |||||||||
| Long Term Growth Rate, % | 3.00 | |||||||||
| Free cash flow (T + 1) | 506 | |||||||||
| Terminal Value | 24,171 | |||||||||
| Present Terminal Value | 18,854 | |||||||||
| Enterprise Value | 21,224 | |||||||||
| Net Debt | -2,108 | |||||||||
| Equity Value | 23,331 | |||||||||
| Diluted Shares Outstanding, MM | 467 | |||||||||
| Equity Value Per Share | 49.97 |
What You Will Receive
- Customizable Fashion Inputs: Effortlessly adjust parameters (growth %, profit margins, market trends) to explore various scenarios.
- Industry-Specific Data: Dazzle Fashion Co., Ltd’s financial information pre-loaded to enhance your analysis.
- Automated Valuation Outputs: The template computes Net Present Value (NPV) and intrinsic value automatically.
- Sleek and Adaptable: A sophisticated Excel model designed to meet your valuation requirements.
- Designed for Analysts and Investors: Perfect for evaluating forecasts, testing strategies, and optimizing efficiency.
Key Features
- 🔍 Real-Life Dazzle Fashion Financials: Pre-filled historical and projected data for Dazzle Fashion Co., Ltd (603587SS).
- ✏️ Fully Customizable Inputs: Adjust all essential parameters (yellow cells) such as WACC, growth %, and tax rates.
- 📊 Professional DCF Valuation: Integrated formulas calculate Dazzle Fashion’s intrinsic value using the Discounted Cash Flow method.
- ⚡ Instant Results: Visualize Dazzle Fashion’s valuation immediately after making adjustments.
- Scenario Analysis: Evaluate and compare various financial assumptions side-by-side.
How It Functions
- Step 1: Download the ready-to-use Excel template containing Dazzle Fashion's data.
- Step 2: Review the populated sheets to familiarize yourself with the essential metrics.
- Step 3: Modify forecasts and assumptions in the editable yellow cells (WACC, growth, margins).
- Step 4: Instantly see updated results, including Dazzle Fashion's intrinsic value.
- Step 5: Use the outputs to make informed investment choices or create comprehensive reports.
Why Choose Dazzle Fashion Co., Ltd (603587SS)?
- User-Friendly Interface: Ideal for both novices and seasoned professionals.
- Customizable Parameters: Effortlessly adjust inputs to tailor your analysis.
- Real-Time Adjustments: Instantly observe changes in Dazzle Fashion’s valuation as you modify inputs.
- Pre-Loaded Data: Comes equipped with Dazzle Fashion’s latest financial figures for swift evaluations.
- Preferred by Experts: Renowned by investors and analysts for making well-informed choices.
Who Should Consider Dazzle Fashion Co., Ltd (603587SS)?
- Investors: Gain confidence in your investment choices with our industry-leading analysis tools.
- Market Analysts: Enhance your efficiency with tailored reports that are ready for modification.
- Fashion Consultants: Easily modify our templates for impactful presentations or client deliverables.
- Fashion Enthusiasts: Expand your knowledge of market trends and valuation methods through real-life case studies.
- Educators and Students: Utilize it as a hands-on resource in fashion and business courses.
Components of the Template
- Pre-Filled Data: Contains Dazzle Fashion Co., Ltd's historical financial figures and projections.
- Discounted Cash Flow Model: An editable DCF valuation model featuring automatic calculations.
- Weighted Average Cost of Capital (WACC): A dedicated worksheet for WACC calculations based on your custom inputs.
- Key Financial Ratios: Assess Dazzle Fashion Co., Ltd's profitability, operational efficiency, and financial leverage.
- Customizable Inputs: Easily modify revenue growth, profit margins, and tax rates.
- Clear Dashboard: Visual representations, including charts and tables, summarizing essential valuation outcomes.
Disclaimer
All information, articles, and product details provided on this website are for general informational and educational purposes only. We do not claim any ownership over, nor do we intend to infringe upon, any trademarks, copyrights, logos, brand names, or other intellectual property mentioned or depicted on this site. Such intellectual property remains the property of its respective owners, and any references here are made solely for identification or informational purposes, without implying any affiliation, endorsement, or partnership.
We make no representations or warranties, express or implied, regarding the accuracy, completeness, or suitability of any content or products presented. Nothing on this website should be construed as legal, tax, investment, financial, medical, or other professional advice. In addition, no part of this site—including articles or product references—constitutes a solicitation, recommendation, endorsement, advertisement, or offer to buy or sell any securities, franchises, or other financial instruments, particularly in jurisdictions where such activity would be unlawful.
All content is of a general nature and may not address the specific circumstances of any individual or entity. It is not a substitute for professional advice or services. Any actions you take based on the information provided here are strictly at your own risk. You accept full responsibility for any decisions or outcomes arising from your use of this website and agree to release us from any liability in connection with your use of, or reliance upon, the content or products found herein.