
|
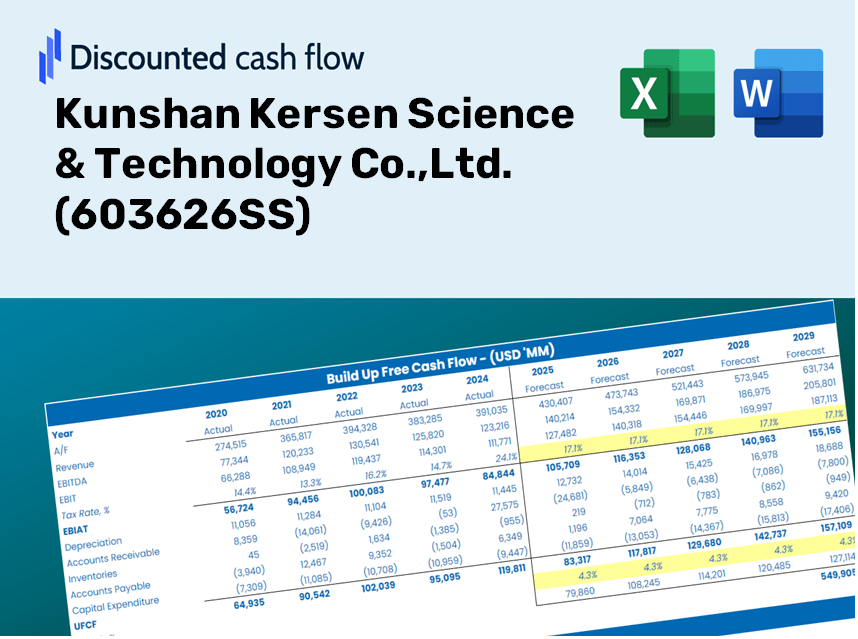
Kunshan Kersen Science & Technology Co.,Ltd. (603626.SS) DCF Valuation |
Fully Editable: Tailor To Your Needs In Excel Or Sheets
Professional Design: Trusted, Industry-Standard Templates
Investor-Approved Valuation Models
MAC/PC Compatible, Fully Unlocked
No Expertise Is Needed; Easy To Follow
Kunshan Kersen Science & Technology Co.,Ltd. (603626.SS) Bundle
Simplify Kunshan Kersen Science & Technology Co., Ltd. valuation with this customizable DCF Calculator! Featuring real Kunshan Kersen Science & Technology Co., Ltd. financials and adjustable forecast inputs, you can test scenarios and uncover Kunshan Kersen Science & Technology Co., Ltd. fair value in minutes.
Discounted Cash Flow (DCF) - (USD MM)
| Year | AY1 2020 |
AY2 2021 |
AY3 2022 |
AY4 2023 |
AY5 2024 |
FY1 2025 |
FY2 2026 |
FY3 2027 |
FY4 2028 |
FY5 2029 |
|---|---|---|---|---|---|---|---|---|---|---|
| Revenue | 3,467.0 | 4,147.0 | 3,423.7 | 2,596.6 | 3,382.3 | 3,852.6 | 4,388.4 | 4,998.7 | 5,693.9 | 6,485.8 |
| Revenue Growth, % | 0 | 19.61 | -17.44 | -24.16 | 30.26 | 13.91 | 13.91 | 13.91 | 13.91 | 13.91 |
| EBITDA | 293.1 | 502.9 | 394.6 | 176.1 | -74.0 | 282.8 | 322.1 | 366.9 | 417.9 | 476.0 |
| EBITDA, % | 8.45 | 12.13 | 11.53 | 6.78 | -2.19 | 7.34 | 7.34 | 7.34 | 7.34 | 7.34 |
| Depreciation | 270.5 | 333.5 | 378.1 | 393.9 | 353.8 | 404.7 | 461.0 | 525.1 | 598.1 | 681.3 |
| Depreciation, % | 7.8 | 8.04 | 11.04 | 15.17 | 10.46 | 10.5 | 10.5 | 10.5 | 10.5 | 10.5 |
| EBIT | 22.6 | 169.4 | 16.5 | -217.9 | -427.8 | -121.9 | -138.9 | -158.2 | -180.2 | -205.2 |
| EBIT, % | 0.65129 | 4.09 | 0.48048 | -8.39 | -12.65 | -3.16 | -3.16 | -3.16 | -3.16 | -3.16 |
| Total Cash | 280.1 | 419.2 | 415.6 | 397.3 | 388.4 | 440.1 | 501.3 | 571.0 | 650.4 | 740.8 |
| Total Cash, percent | .0 | .0 | .0 | .0 | .0 | .0 | .0 | .0 | .0 | .0 |
| Account Receivables | 1,645.6 | 1,949.0 | 1,473.5 | 1,085.2 | 1,390.0 | 1,698.2 | 1,934.3 | 2,203.3 | 2,509.8 | 2,858.8 |
| Account Receivables, % | 47.46 | 47 | 43.04 | 41.79 | 41.1 | 44.08 | 44.08 | 44.08 | 44.08 | 44.08 |
| Inventories | 505.7 | 369.7 | 335.2 | 376.2 | 474.3 | 476.2 | 542.4 | 617.8 | 703.8 | 801.6 |
| Inventories, % | 14.59 | 8.91 | 9.79 | 14.49 | 14.02 | 12.36 | 12.36 | 12.36 | 12.36 | 12.36 |
| Accounts Payable | 1,450.8 | 1,014.1 | 933.5 | 850.1 | 1,388.9 | 1,289.6 | 1,469.0 | 1,673.3 | 1,906.0 | 2,171.1 |
| Accounts Payable, % | 41.85 | 24.45 | 27.27 | 32.74 | 41.07 | 33.47 | 33.47 | 33.47 | 33.47 | 33.47 |
| Capital Expenditure | -732.9 | -594.1 | -434.5 | -457.7 | -302.3 | -575.7 | -655.8 | -747.0 | -850.9 | -969.2 |
| Capital Expenditure, % | -21.14 | -14.32 | -12.69 | -17.63 | -8.94 | -14.94 | -14.94 | -14.94 | -14.94 | -14.94 |
| Tax Rate, % | 8.34 | 8.34 | 8.34 | 8.34 | 8.34 | 8.34 | 8.34 | 8.34 | 8.34 | 8.34 |
| EBITAT | 16.8 | 176.9 | 13.3 | -215.5 | -392.1 | -108.7 | -123.8 | -141.0 | -160.6 | -183.0 |
| Depreciation | ||||||||||
| Changes in Account Receivables | ||||||||||
| Changes in Inventories | ||||||||||
| Changes in Accounts Payable | ||||||||||
| Capital Expenditure | ||||||||||
| UFCF | -1,146.1 | -687.8 | 386.3 | -15.3 | -204.7 | -689.1 | -441.7 | -503.1 | -573.1 | -652.7 |
| WACC, % | 8.3 | 8.45 | 8.34 | 8.45 | 8.4 | 8.39 | 8.39 | 8.39 | 8.39 | 8.39 |
| PV UFCF | ||||||||||
| SUM PV UFCF | -2,258.3 | |||||||||
| Long Term Growth Rate, % | 3.00 | |||||||||
| Free cash flow (T + 1) | -672 | |||||||||
| Terminal Value | -12,474 | |||||||||
| Present Terminal Value | -8,338 | |||||||||
| Enterprise Value | -10,597 | |||||||||
| Net Debt | 812 | |||||||||
| Equity Value | -11,409 | |||||||||
| Diluted Shares Outstanding, MM | 554 | |||||||||
| Equity Value Per Share | -20.58 |
What You'll Receive
- Comprehensive (603626SS) Financial Data: Pre-loaded with Kunshan Kersen Science & Technology's historical and projected figures for accurate analysis.
- Customizable Template: Easily adjust key variables such as revenue growth, WACC, and EBITDA percentage.
- Instant Calculations: View real-time updates of Kunshan Kersen’s intrinsic value as you make adjustments.
- Professional Valuation Instrument: Tailored for investors, analysts, and consultants looking for precise DCF outcomes.
- Intuitive Design: Clear layout and straightforward instructions suitable for users of all skill levels.
Key Features
- Comprehensive Historical Data: Detailed financial statements and forecasts for Kunshan Kersen Science & Technology Co., Ltd.
- Customizable Parameters: Modify WACC, tax rates, revenue growth, and EBITDA margins to suit your analysis.
- Real-Time Valuation: Watch the intrinsic value of Kunshan Kersen Science & Technology Co., Ltd. recalibrate instantly.
- Intuitive Visualizations: Interactive dashboard charts present valuation outcomes and essential metrics clearly.
- Designed for Precision: A reliable resource for analysts, investors, and finance professionals.
How It Operates
- Step 1: Download the Excel file.
- Step 2: Examine the pre-filled financial data and forecasts for Kunshan Kersen Science & Technology Co., Ltd. (603626SS).
- Step 3: Adjust key inputs such as revenue growth, WACC, and tax rates (highlighted cells).
- Step 4: Observe the DCF model update in real-time as you modify your assumptions.
- Step 5: Evaluate the results and apply the findings to your investment strategies.
Why Opt for Kunshan Kersen Science & Technology Co.,Ltd. Calculator?
- Time Efficient: Skip the hassle of building a DCF model from the ground up – it's ready for immediate use.
- Enhanced Precision: Dependable financial data and formulas minimize valuation errors.
- Completely Customizable: Adjust the model to align with your own assumptions and forecasts.
- Simple to Understand: Intuitive charts and outputs ensure the results are easily interpretable.
- Endorsed by Professionals: Created for experts who prioritize accuracy and user-friendliness.
Who Can Benefit from This Product?
- Engineering Students: Acquire practical skills in technology application and project management.
- Researchers: Utilize advanced models and methodologies for innovative technology studies.
- Investors: Evaluate your investment strategies and assess the performance metrics of Kersen Technology (603626SS).
- Industry Analysts: Enhance your analysis with a customizable framework tailored for technology assessments.
- Entrepreneurs: Discover how leading firms like Kersen Technology are positioned in the market.
Contents of the Template
- Operating and Balance Sheet Data: Pre-filled historical data and forecasts for Kunshan Kersen Science & Technology Co., Ltd. (603626SS), including metrics such as revenue, EBITDA, EBIT, and capital expenditures.
- WACC Calculation: A dedicated worksheet for Weighted Average Cost of Capital (WACC), featuring inputs like Beta, risk-free rate, and share price.
- DCF Valuation (Unlevered and Levered): Customizable Discounted Cash Flow models that provide intrinsic value along with comprehensive calculations.
- Financial Statements: Pre-loaded annual and quarterly financial statements to facilitate thorough analysis.
- Key Ratios: Includes profitability, leverage, and efficiency ratios relevant to Kunshan Kersen Science & Technology Co., Ltd. (603626SS).
- Dashboard and Charts: A visual overview of valuation outputs and assumptions for easy result evaluation.
Disclaimer
All information, articles, and product details provided on this website are for general informational and educational purposes only. We do not claim any ownership over, nor do we intend to infringe upon, any trademarks, copyrights, logos, brand names, or other intellectual property mentioned or depicted on this site. Such intellectual property remains the property of its respective owners, and any references here are made solely for identification or informational purposes, without implying any affiliation, endorsement, or partnership.
We make no representations or warranties, express or implied, regarding the accuracy, completeness, or suitability of any content or products presented. Nothing on this website should be construed as legal, tax, investment, financial, medical, or other professional advice. In addition, no part of this site—including articles or product references—constitutes a solicitation, recommendation, endorsement, advertisement, or offer to buy or sell any securities, franchises, or other financial instruments, particularly in jurisdictions where such activity would be unlawful.
All content is of a general nature and may not address the specific circumstances of any individual or entity. It is not a substitute for professional advice or services. Any actions you take based on the information provided here are strictly at your own risk. You accept full responsibility for any decisions or outcomes arising from your use of this website and agree to release us from any liability in connection with your use of, or reliance upon, the content or products found herein.