
|
Shanghai Putailai New Energy Technology Co.,Ltd. (603659.SS) DCF Valuation |
Fully Editable: Tailor To Your Needs In Excel Or Sheets
Professional Design: Trusted, Industry-Standard Templates
Investor-Approved Valuation Models
MAC/PC Compatible, Fully Unlocked
No Expertise Is Needed; Easy To Follow
Shanghai Putailai New Energy Technology Co.,Ltd. (603659.SS) Bundle
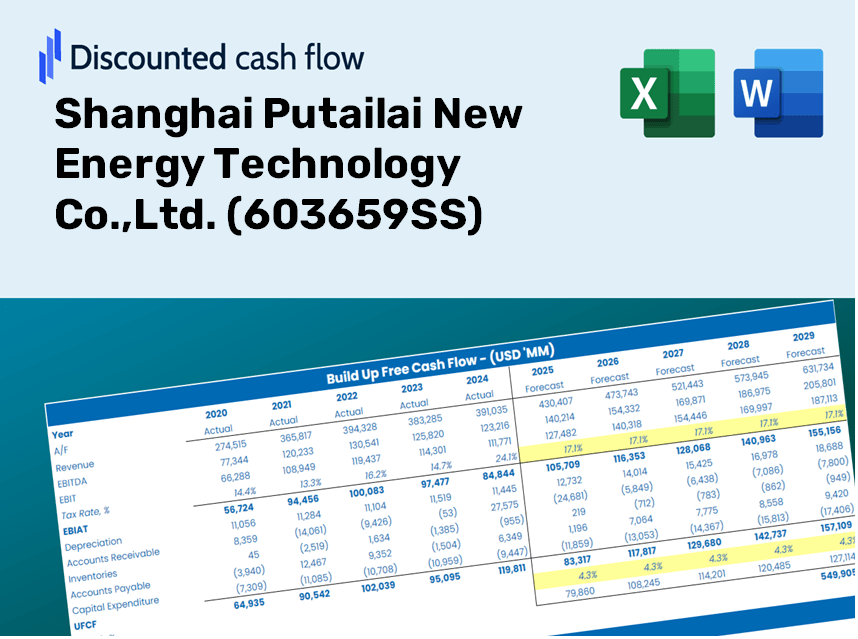
Gain mastery over your Shanghai Putailai New Energy Technology Co.,Ltd. (603659SS) valuation analysis with our sophisticated DCF Calculator! Preloaded with real (603659SS) data, this Excel template empowers you to adjust forecasts and assumptions for accurately calculating the intrinsic value of Shanghai Putailai New Energy Technology Co.,Ltd.
Discounted Cash Flow (DCF) - (USD MM)
| Year | AY1 2020 |
AY2 2021 |
AY3 2022 |
AY4 2023 |
AY5 2024 |
FY1 2025 |
FY2 2026 |
FY3 2027 |
FY4 2028 |
FY5 2029 |
|---|---|---|---|---|---|---|---|---|---|---|
| Revenue | 5,280.7 | 8,995.9 | 15,463.9 | 15,340.0 | 13,448.4 | 17,789.7 | 23,532.3 | 31,128.6 | 41,177.2 | 54,469.4 |
| Revenue Growth, % | 0 | 70.36 | 71.9 | -0.80099 | -12.33 | 32.28 | 32.28 | 32.28 | 32.28 | 32.28 |
| EBITDA | 1,137.5 | 2,332.4 | 4,055.4 | 2,887.6 | 2,331.9 | 3,908.6 | 5,170.3 | 6,839.4 | 9,047.1 | 11,967.6 |
| EBITDA, % | 21.54 | 25.93 | 26.23 | 18.82 | 17.34 | 21.97 | 21.97 | 21.97 | 21.97 | 21.97 |
| Depreciation | 193.0 | 341.9 | 522.1 | 658.9 | 830.0 | 757.8 | 1,002.4 | 1,326.0 | 1,754.0 | 2,320.2 |
| Depreciation, % | 3.66 | 3.8 | 3.38 | 4.3 | 6.17 | 4.26 | 4.26 | 4.26 | 4.26 | 4.26 |
| EBIT | 944.5 | 1,990.5 | 3,533.3 | 2,228.8 | 1,501.9 | 3,150.8 | 4,167.9 | 5,513.4 | 7,293.1 | 9,647.4 |
| EBIT, % | 17.89 | 22.13 | 22.85 | 14.53 | 11.17 | 17.71 | 17.71 | 17.71 | 17.71 | 17.71 |
| Total Cash | 6,002.8 | 5,528.6 | 7,990.3 | 10,627.1 | 8,568.8 | 12,314.7 | 16,290.0 | 21,548.5 | 28,504.5 | 37,705.9 |
| Total Cash, percent | .0 | .0 | .0 | .0 | .0 | .0 | .0 | .0 | .0 | .0 |
| Account Receivables | 1,731.7 | 2,020.3 | 4,625.3 | 5,256.5 | 5,493.2 | 5,702.4 | 7,543.2 | 9,978.2 | 13,199.2 | 17,460.0 |
| Account Receivables, % | 32.79 | 22.46 | 29.91 | 34.27 | 40.85 | 32.05 | 32.05 | 32.05 | 32.05 | 32.05 |
| Inventories | 2,236.5 | 4,963.6 | 11,035.0 | 11,478.0 | 8,364.5 | 10,884.0 | 14,397.5 | 19,045.0 | 25,192.9 | 33,325.3 |
| Inventories, % | 42.35 | 55.18 | 71.36 | 74.82 | 62.2 | 61.18 | 61.18 | 61.18 | 61.18 | 61.18 |
| Accounts Payable | 2,255.3 | 4,658.2 | 7,759.7 | 7,311.3 | 1,036.4 | 7,117.2 | 9,414.7 | 12,453.8 | 16,474.0 | 21,791.9 |
| Accounts Payable, % | 42.71 | 51.78 | 50.18 | 47.66 | 7.71 | 40.01 | 40.01 | 40.01 | 40.01 | 40.01 |
| Capital Expenditure | -749.6 | -2,672.0 | -2,831.7 | -3,971.1 | -3,263.3 | -3,997.7 | -5,288.2 | -6,995.3 | -9,253.5 | -12,240.5 |
| Capital Expenditure, % | -14.2 | -29.7 | -18.31 | -25.89 | -24.27 | -22.47 | -22.47 | -22.47 | -22.47 | -22.47 |
| Tax Rate, % | 21.5 | 21.5 | 21.5 | 21.5 | 21.5 | 21.5 | 21.5 | 21.5 | 21.5 | 21.5 |
| EBITAT | 773.2 | 1,715.3 | 2,987.6 | 1,812.0 | 1,179.0 | 2,598.8 | 3,437.7 | 4,547.4 | 6,015.4 | 7,957.2 |
| Depreciation | ||||||||||
| Changes in Account Receivables | ||||||||||
| Changes in Inventories | ||||||||||
| Changes in Accounts Payable | ||||||||||
| Capital Expenditure | ||||||||||
| UFCF | -1,496.2 | -1,227.5 | -4,896.9 | -3,022.8 | -4,652.6 | 2,710.9 | -3,904.8 | -5,165.3 | -6,832.8 | -9,038.4 |
| WACC, % | 7.62 | 7.63 | 7.63 | 7.61 | 7.6 | 7.62 | 7.62 | 7.62 | 7.62 | 7.62 |
| PV UFCF | ||||||||||
| SUM PV UFCF | -16,352.2 | |||||||||
| Long Term Growth Rate, % | 4.00 | |||||||||
| Free cash flow (T + 1) | -9,400 | |||||||||
| Terminal Value | -259,821 | |||||||||
| Present Terminal Value | -179,992 | |||||||||
| Enterprise Value | -196,344 | |||||||||
| Net Debt | 1,843 | |||||||||
| Equity Value | -198,187 | |||||||||
| Diluted Shares Outstanding, MM | 2,126 | |||||||||
| Equity Value Per Share | -93.22 |
What You Will Receive
- Customizable Excel Template: An adaptable Excel-based DCF Calculator featuring pre-loaded financial data for Shanghai Putailai New Energy Technology Co., Ltd. (603659SS).
- Comprehensive Data: Access to historical data along with forward-looking projections (highlighted in the yellow cells).
- Adjustable Forecasts: Modify key assumptions such as revenue growth, EBITDA percentage, and WACC.
- Instant Calculations: Quickly observe how your inputs affect the valuation of Shanghai Putailai New Energy Technology Co., Ltd. (603659SS).
- Professional Resource: Designed for investors, CFOs, consultants, and financial analysts.
- Intuitive Layout: Organized for ease of understanding and usability, complete with step-by-step guidance.
Key Features
- Customizable Forecast Inputs: Adjust essential parameters such as revenue growth, EBITDA %, and capital investments.
- Instant DCF Valuation: Quickly computes intrinsic value, NPV, and other financial metrics.
- High-Precision Accuracy: Leverages the real-world financial data of Shanghai Putailai New Energy Technology Co., Ltd. (603659SS) for credible valuation results.
- Simplified Scenario Analysis: Effortlessly evaluate various assumptions and analyze their impacts.
- Efficient Valuation Tool: Avoid the hassle of creating intricate valuation models from the ground up.
How It Functions
- Obtain the Template: Gain immediate access to the Excel-based Shanghai Putailai (603659SS) DCF Calculator.
- Enter Your Assumptions: Modify the yellow-highlighted cells for growth rates, WACC, margins, and additional parameters.
- Real-Time Calculations: The model automatically refreshes to reflect the intrinsic value of Shanghai Putailai (603659SS).
- Explore Scenarios: Experiment with various assumptions to assess potential changes in valuation.
- Evaluate and Decide: Utilize the outcomes to inform your investment or financial analysis strategy.
Why Choose This Calculator for Shanghai Putailai New Energy Technology Co., Ltd. (603659SS)?
- User-Friendly Interface: Perfect for both novices and seasoned analysts.
- Customizable Variables: Adjust inputs effortlessly to suit your evaluation needs.
- Real-Time Valuation Adjustments: Witness immediate updates to Shanghai Putailai’s valuation as you change inputs.
- Preloaded Financial Data: Equipped with Shanghai Putailai’s current financial metrics for swift assessments.
- Relied Upon by Professionals: Favored by investors and analysts for making well-informed decisions.
Who Can Benefit from This Product?
- Institutional Investors: Develop comprehensive and precise valuation models for analyzing portfolios involving Shanghai Putailai New Energy Technology Co., Ltd. (603659SS).
- Corporate Finance Departments: Examine valuation scenarios to inform strategic decisions within your organization.
- Consultants and Financial Advisors: Equip clients with reliable valuation insights pertaining to Shanghai Putailai New Energy Technology Co., Ltd. (603659SS).
- Students and Academic Professionals: Utilize real-world data to enhance learning in financial modeling and analysis.
- Energy Sector Enthusiasts: Gain insights into how companies like Shanghai Putailai New Energy Technology Co., Ltd. (603659SS) are valued in the market.
Contents of the Template
- Preloaded 603659SS Data: Historical and projected financial figures, including revenue, EBIT, and capital expenditures.
- DCF and WACC Models: Professional-grade worksheets for determining intrinsic value and Weighted Average Cost of Capital.
- Editable Inputs: Highlighted cells for adjusting revenue growth, tax rates, and discount rates.
- Financial Statements: Detailed annual and quarterly financial reports for in-depth analysis.
- Key Ratios: Ratios for profitability, leverage, and efficiency to assess performance.
- Dashboard and Charts: Visual representations of valuation results and underlying assumptions.
Disclaimer
All information, articles, and product details provided on this website are for general informational and educational purposes only. We do not claim any ownership over, nor do we intend to infringe upon, any trademarks, copyrights, logos, brand names, or other intellectual property mentioned or depicted on this site. Such intellectual property remains the property of its respective owners, and any references here are made solely for identification or informational purposes, without implying any affiliation, endorsement, or partnership.
We make no representations or warranties, express or implied, regarding the accuracy, completeness, or suitability of any content or products presented. Nothing on this website should be construed as legal, tax, investment, financial, medical, or other professional advice. In addition, no part of this site—including articles or product references—constitutes a solicitation, recommendation, endorsement, advertisement, or offer to buy or sell any securities, franchises, or other financial instruments, particularly in jurisdictions where such activity would be unlawful.
All content is of a general nature and may not address the specific circumstances of any individual or entity. It is not a substitute for professional advice or services. Any actions you take based on the information provided here are strictly at your own risk. You accept full responsibility for any decisions or outcomes arising from your use of this website and agree to release us from any liability in connection with your use of, or reliance upon, the content or products found herein.