
|
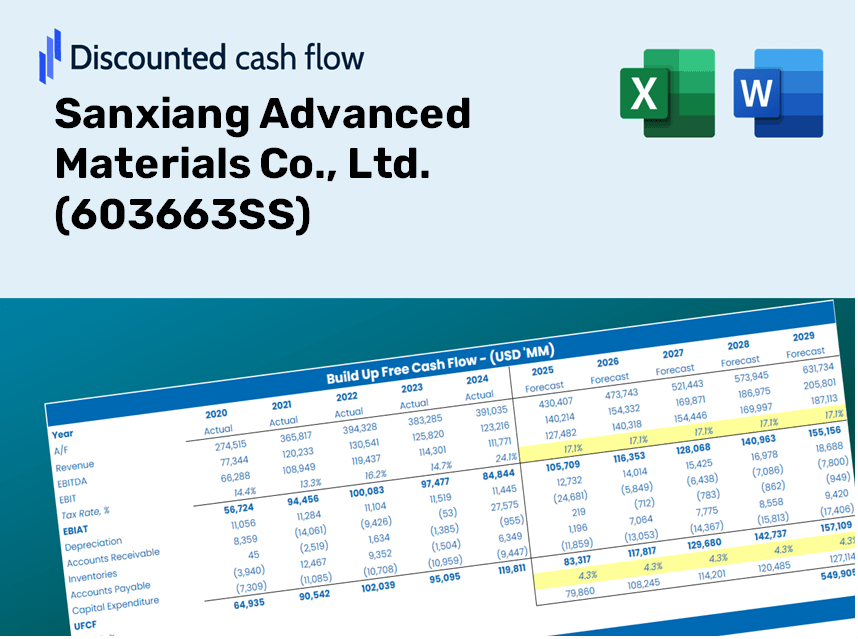
Sanxiang Advanced Materials Co., Ltd. (603663.SS) DCF Valuation |
Fully Editable: Tailor To Your Needs In Excel Or Sheets
Professional Design: Trusted, Industry-Standard Templates
Investor-Approved Valuation Models
MAC/PC Compatible, Fully Unlocked
No Expertise Is Needed; Easy To Follow
Sanxiang Advanced Materials Co., Ltd. (603663.SS) Bundle
Looking to determine the intrinsic value of Sanxiang Advanced Materials Co., Ltd.? Our (603663SS) DCF Calculator integrates real-world data with comprehensive customization features, enabling you to refine your forecasts and enhance your investment choices.
Discounted Cash Flow (DCF) - (USD MM)
| Year | AY1 2020 |
AY2 2021 |
AY3 2022 |
AY4 2023 |
AY5 2024 |
FY1 2025 |
FY2 2026 |
FY3 2027 |
FY4 2028 |
FY5 2029 |
|---|---|---|---|---|---|---|---|---|---|---|
| Revenue | 733.1 | 789.2 | 972.3 | 1,079.9 | 1,053.9 | 1,158.0 | 1,272.4 | 1,398.1 | 1,536.1 | 1,687.9 |
| Revenue Growth, % | 0 | 7.65 | 23.2 | 11.07 | -2.41 | 9.88 | 9.88 | 9.88 | 9.88 | 9.88 |
| EBITDA | 134.4 | 180.8 | 240.6 | 150.7 | 150.4 | 218.2 | 239.7 | 263.4 | 289.4 | 318.0 |
| EBITDA, % | 18.33 | 22.91 | 24.74 | 13.95 | 14.27 | 18.84 | 18.84 | 18.84 | 18.84 | 18.84 |
| Depreciation | 36.8 | 45.3 | 44.6 | 53.5 | 67.5 | 61.8 | 67.9 | 74.7 | 82.0 | 90.1 |
| Depreciation, % | 5.02 | 5.74 | 4.59 | 4.95 | 6.4 | 5.34 | 5.34 | 5.34 | 5.34 | 5.34 |
| EBIT | 97.6 | 135.5 | 196.0 | 97.2 | 82.9 | 156.3 | 171.8 | 188.8 | 207.4 | 227.9 |
| EBIT, % | 13.31 | 17.17 | 20.15 | 9 | 7.87 | 13.5 | 13.5 | 13.5 | 13.5 | 13.5 |
| Total Cash | 65.3 | 194.1 | 97.8 | 64.4 | 73.1 | 130.8 | 143.7 | 157.9 | 173.5 | 190.6 |
| Total Cash, percent | .0 | .0 | .0 | .0 | .0 | .0 | .0 | .0 | .0 | .0 |
| Account Receivables | 217.3 | 181.7 | 290.7 | 414.1 | 402.4 | 368.4 | 404.8 | 444.8 | 488.8 | 537.0 |
| Account Receivables, % | 29.64 | 23.03 | 29.9 | 38.35 | 38.18 | 31.82 | 31.82 | 31.82 | 31.82 | 31.82 |
| Inventories | 173.7 | 169.6 | 297.1 | 304.8 | 273.5 | 300.9 | 330.6 | 363.3 | 399.2 | 438.6 |
| Inventories, % | 23.69 | 21.49 | 30.56 | 28.23 | 25.96 | 25.98 | 25.98 | 25.98 | 25.98 | 25.98 |
| Accounts Payable | 110.2 | 99.0 | 199.5 | 306.8 | 254.9 | 233.2 | 256.2 | 281.5 | 309.4 | 339.9 |
| Accounts Payable, % | 15.03 | 12.54 | 20.52 | 28.41 | 24.19 | 20.14 | 20.14 | 20.14 | 20.14 | 20.14 |
| Capital Expenditure | -249.7 | -103.1 | -134.3 | -94.3 | -79.3 | -178.8 | -196.4 | -215.8 | -237.1 | -260.6 |
| Capital Expenditure, % | -34.06 | -13.06 | -13.81 | -8.73 | -7.53 | -15.44 | -15.44 | -15.44 | -15.44 | -15.44 |
| Tax Rate, % | -2.86 | -2.86 | -2.86 | -2.86 | -2.86 | -2.86 | -2.86 | -2.86 | -2.86 | -2.86 |
| EBITAT | 74.0 | 113.0 | 158.3 | 95.6 | 85.3 | 137.1 | 150.6 | 165.5 | 181.8 | 199.8 |
| Depreciation | ||||||||||
| Changes in Account Receivables | ||||||||||
| Changes in Inventories | ||||||||||
| Changes in Accounts Payable | ||||||||||
| Capital Expenditure | ||||||||||
| UFCF | -419.6 | 83.6 | -67.3 | 31.0 | 64.5 | 5.0 | -21.0 | -23.0 | -25.3 | -27.8 |
| WACC, % | 5.43 | 5.44 | 5.44 | 5.45 | 5.45 | 5.44 | 5.44 | 5.44 | 5.44 | 5.44 |
| PV UFCF | ||||||||||
| SUM PV UFCF | -75.5 | |||||||||
| Long Term Growth Rate, % | 3.50 | |||||||||
| Free cash flow (T + 1) | -29 | |||||||||
| Terminal Value | -1,480 | |||||||||
| Present Terminal Value | -1,136 | |||||||||
| Enterprise Value | -1,211 | |||||||||
| Net Debt | 227 | |||||||||
| Equity Value | -1,438 | |||||||||
| Diluted Shares Outstanding, MM | 421 | |||||||||
| Equity Value Per Share | -3.42 |
Benefits of Using Our Template
- Customizable Forecast Inputs: Modify key assumptions (growth %, margins, WACC) effortlessly to explore various scenarios.
- Real Data Integration: Pre-filled financial information for Sanxiang Advanced Materials Co., Ltd. (603663SS) to kickstart your analysis.
- Automated DCF Calculations: The template automatically computes Net Present Value (NPV) and intrinsic value for your convenience.
- Professional and Adaptable: A sleek Excel model designed to fit your valuation requirements.
- Designed for Analysts and Investors: Perfect for evaluating forecasts, validating strategies, and optimizing efficiency.
Key Features
- Real-Life 603663SS Data: Instantly populated with Sanxiang Advanced Materials’ historical financial performance and future projections.
- Fully Customizable Inputs: Modify revenue growth rates, profit margins, WACC, tax percentages, and capital spending as needed.
- Dynamic Valuation Model: Automatically refreshes Net Present Value (NPV) and intrinsic value based on your adjustments.
- Scenario Testing: Develop various forecasting scenarios to examine potential valuation results.
- User-Friendly Design: Intuitive and organized, catering to both professionals and newcomers.
How It Works
- Download the Template: Gain immediate access to the Excel-based Sanxiang Advanced Materials DCF Calculator.
- Input Your Assumptions: Modify the yellow-highlighted cells for growth rates, WACC, margins, and more.
- Instant Calculations: The model will automatically refresh Sanxiang Advanced Materials' intrinsic value.
- Test Scenarios: Experiment with different assumptions to assess potential valuation shifts.
- Analyze and Decide: Utilize the results to inform your investment or financial decisions.
Why Choose This Calculator for Sanxiang Advanced Materials Co., Ltd. (603663SS)?
- All-in-One Solution: Features DCF, WACC, and financial ratio analyses all in a single tool.
- Flexible Settings: Modify the yellow-highlighted fields to explore different financial scenarios.
- In-Depth Analysis: Automatically computes Sanxiang’s intrinsic value and Net Present Value.
- Preloaded Information: Utilizes historical and projected data for reliable benchmarks.
- High-Quality Standards: Perfect for financial analysts, investors, and business consultants.
Who Can Benefit from This Product?
- Investors: Accurately assess the fair value of Sanxiang Advanced Materials Co., Ltd. (603663SS) before making investment choices.
- CFOs: Utilize a top-tier DCF model for financial reporting and strategic analysis.
- Consultants: Efficiently modify the template for client valuation reports.
- Entrepreneurs: Acquire insights into financial modeling practices employed by leading companies.
- Educators: Implement it as a teaching resource to illustrate valuation techniques.
What the Template Includes
- Preloaded 603663SS Data: Historical and forecasted financial information, encompassing revenue, EBIT, and capital expenditures.
- DCF and WACC Models: Professional templates designed for calculating intrinsic value and Weighted Average Cost of Capital.
- Editable Inputs: Cells highlighted in yellow for modifying revenue growth rates, tax percentages, and discount rates.
- Financial Statements: Detailed annual and quarterly financial reports for thorough analysis.
- Key Ratios: Ratios for profitability, leverage, and efficiency to assess overall performance.
- Dashboard and Charts: Graphical representations of valuation outcomes and key assumptions.
Disclaimer
All information, articles, and product details provided on this website are for general informational and educational purposes only. We do not claim any ownership over, nor do we intend to infringe upon, any trademarks, copyrights, logos, brand names, or other intellectual property mentioned or depicted on this site. Such intellectual property remains the property of its respective owners, and any references here are made solely for identification or informational purposes, without implying any affiliation, endorsement, or partnership.
We make no representations or warranties, express or implied, regarding the accuracy, completeness, or suitability of any content or products presented. Nothing on this website should be construed as legal, tax, investment, financial, medical, or other professional advice. In addition, no part of this site—including articles or product references—constitutes a solicitation, recommendation, endorsement, advertisement, or offer to buy or sell any securities, franchises, or other financial instruments, particularly in jurisdictions where such activity would be unlawful.
All content is of a general nature and may not address the specific circumstances of any individual or entity. It is not a substitute for professional advice or services. Any actions you take based on the information provided here are strictly at your own risk. You accept full responsibility for any decisions or outcomes arising from your use of this website and agree to release us from any liability in connection with your use of, or reliance upon, the content or products found herein.