
|
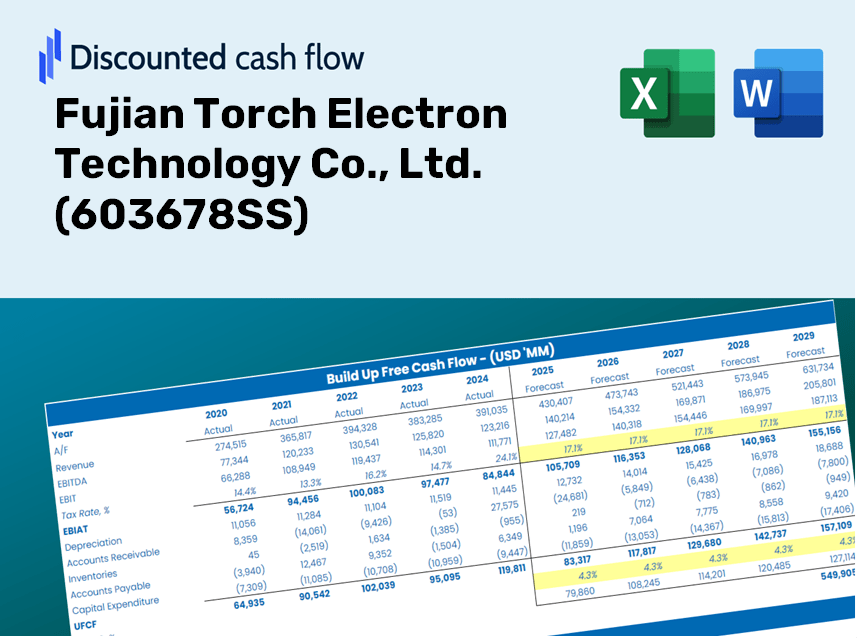
Fujian Torch Electron Technology Co., Ltd. (603678.SS) DCF Valuation |
Fully Editable: Tailor To Your Needs In Excel Or Sheets
Professional Design: Trusted, Industry-Standard Templates
Investor-Approved Valuation Models
MAC/PC Compatible, Fully Unlocked
No Expertise Is Needed; Easy To Follow
Fujian Torch Electron Technology Co., Ltd. (603678.SS) Bundle
Gain insights into your Fujian Torch Electron Technology Co., Ltd. (603678SS) valuation analysis using our sophisticated DCF Calculator! This Excel template comes preloaded with accurate (603678SS) data, enabling you to adjust forecasts and assumptions to determine the intrinsic value of Fujian Torch Electron Technology Co., Ltd. with precision.
Discounted Cash Flow (DCF) - (USD MM)
| Year | AY1 2020 |
AY2 2021 |
AY3 2022 |
AY4 2023 |
AY5 2024 |
FY1 2025 |
FY2 2026 |
FY3 2027 |
FY4 2028 |
FY5 2029 |
|---|---|---|---|---|---|---|---|---|---|---|
| Revenue | 3,656.2 | 4,734.2 | 3,558.7 | 3,503.6 | 2,801.5 | 2,682.9 | 2,569.3 | 2,460.5 | 2,356.3 | 2,256.6 |
| Revenue Growth, % | 0 | 29.48 | -24.83 | -1.55 | -20.04 | -4.23 | -4.23 | -4.23 | -4.23 | -4.23 |
| EBITDA | 855.8 | 1,305.9 | 1,115.6 | 573.2 | 441.4 | 614.1 | 588.1 | 563.2 | 539.4 | 516.6 |
| EBITDA, % | 23.41 | 27.59 | 31.35 | 16.36 | 15.75 | 22.89 | 22.89 | 22.89 | 22.89 | 22.89 |
| Depreciation | 86.1 | 111.3 | 146.4 | 190.5 | 208.9 | 116.5 | 111.6 | 106.9 | 102.3 | 98.0 |
| Depreciation, % | 2.36 | 2.35 | 4.11 | 5.44 | 7.46 | 4.34 | 4.34 | 4.34 | 4.34 | 4.34 |
| EBIT | 769.7 | 1,194.6 | 969.2 | 382.6 | 232.5 | 497.6 | 476.6 | 456.4 | 437.1 | 418.6 |
| EBIT, % | 21.05 | 25.23 | 27.23 | 10.92 | 8.3 | 18.55 | 18.55 | 18.55 | 18.55 | 18.55 |
| Total Cash | 843.9 | 922.2 | 819.2 | 1,149.6 | 996.9 | 718.9 | 688.4 | 659.3 | 631.4 | 604.7 |
| Total Cash, percent | .0 | .0 | .0 | .0 | .0 | .0 | .0 | .0 | .0 | .0 |
| Account Receivables | 2,329.1 | 2,358.0 | 2,510.4 | 2,127.6 | 2,008.2 | 1,698.1 | 1,626.2 | 1,557.3 | 1,491.4 | 1,428.2 |
| Account Receivables, % | 63.7 | 49.81 | 70.54 | 60.73 | 71.68 | 63.29 | 63.29 | 63.29 | 63.29 | 63.29 |
| Inventories | 952.0 | 1,128.7 | 1,238.2 | 1,305.8 | 1,309.6 | 905.1 | 866.8 | 830.1 | 795.0 | 761.3 |
| Inventories, % | 26.04 | 23.84 | 34.79 | 37.27 | 46.75 | 33.74 | 33.74 | 33.74 | 33.74 | 33.74 |
| Accounts Payable | 736.0 | 492.2 | 362.1 | 470.9 | 460.0 | 378.6 | 362.6 | 347.2 | 332.5 | 318.4 |
| Accounts Payable, % | 20.13 | 10.4 | 10.17 | 13.44 | 16.42 | 14.11 | 14.11 | 14.11 | 14.11 | 14.11 |
| Capital Expenditure | -270.9 | -619.9 | -646.1 | -355.1 | -333.6 | -325.7 | -311.9 | -298.7 | -286.1 | -274.0 |
| Capital Expenditure, % | -7.41 | -13.1 | -18.16 | -10.14 | -11.91 | -12.14 | -12.14 | -12.14 | -12.14 | -12.14 |
| Tax Rate, % | 7.65 | 7.65 | 7.65 | 7.65 | 7.65 | 7.65 | 7.65 | 7.65 | 7.65 | 7.65 |
| EBITAT | 614.2 | 972.1 | 798.1 | 340.1 | 214.7 | 422.7 | 404.9 | 387.7 | 371.3 | 355.6 |
| Depreciation | ||||||||||
| Changes in Account Receivables | ||||||||||
| Changes in Inventories | ||||||||||
| Changes in Accounts Payable | ||||||||||
| Capital Expenditure | ||||||||||
| UFCF | -2,115.7 | 14.1 | -93.6 | 599.6 | 194.8 | 846.7 | 298.7 | 286.1 | 273.9 | 262.3 |
| WACC, % | 5.07 | 5.08 | 5.08 | 5.09 | 5.1 | 5.09 | 5.09 | 5.09 | 5.09 | 5.09 |
| PV UFCF | ||||||||||
| SUM PV UFCF | 1,752.1 | |||||||||
| Long Term Growth Rate, % | 2.00 | |||||||||
| Free cash flow (T + 1) | 268 | |||||||||
| Terminal Value | 8,673 | |||||||||
| Present Terminal Value | 6,768 | |||||||||
| Enterprise Value | 8,520 | |||||||||
| Net Debt | 118 | |||||||||
| Equity Value | 8,403 | |||||||||
| Diluted Shares Outstanding, MM | 452 | |||||||||
| Equity Value Per Share | 18.57 |
What You Will Receive
- Adjustable Forecast Inputs: Effortlessly modify assumptions (growth %, margins, WACC) to generate various scenarios.
- Industry Data Included: Fujian Torch Electron Technology's financial data pre-loaded to kickstart your analysis.
- Instant DCF Calculations: The template automatically computes Net Present Value (NPV) and intrinsic value for you.
- Tailored and Professional: A refined Excel model that meets your valuation requirements.
- Designed for Analysts and Investors: Perfect for evaluating projections, validating strategies, and enhancing efficiency.
Key Features
- Pre-Loaded Data: Historical financial statements and pre-filled forecasts for Fujian Torch Electron Technology Co., Ltd. (603678SS).
- Fully Adjustable Inputs: Modify WACC, tax rates, revenue growth, and EBITDA margins as needed.
- Instant Results: View the intrinsic value of Fujian Torch Electron Technology Co., Ltd. (603678SS) recalculated in real time.
- Clear Visual Outputs: Dashboard charts provide a visual representation of valuation results and key metrics.
- Built for Accuracy: A professional-grade tool designed for analysts, investors, and finance professionals.
How It Functions
- Download the Template: Gain immediate access to the Excel-based Fujian Torch DCF Calculator (603678SS).
- Input Your Assumptions: Modify the yellow-highlighted cells for growth rates, WACC, profit margins, and additional parameters.
- Instant Calculations: The model auto-updates to reflect Fujian Torch's intrinsic value.
- Test Scenarios: Explore various assumptions to assess potential changes in valuation.
- Analyze and Decide: Leverage the findings to inform your investment or financial assessments.
Why Choose This Calculator for Fujian Torch Electron Technology Co., Ltd. (603678SS)?
- User-Friendly Interface: Suitable for both newcomers and seasoned analysts.
- Customizable Inputs: Easily adjust parameters to fit your specific analysis needs.
- Real-Time Feedback: Observe immediate changes to Fujian Torch’s valuation as you tweak the inputs.
- Preloaded Data: Comes equipped with Fujian Torch's actual financial figures for swift assessments.
- Preferred by Experts: Commonly utilized by investors and analysts for making well-informed choices.
Who Can Benefit from Fujian Torch Electron Technology Co., Ltd. (603678SS)?
- Investors: Gain the confidence to make informed investment choices with our advanced analytics tools.
- Financial Analysts: Enhance efficiency with our customizable financial models tailored for your needs.
- Consultants: Easily modify our templates for impactful client presentations and comprehensive reports.
- Tech Enthusiasts: Explore and understand cutting-edge technologies through practical, real-world applications.
- Educators and Students: Utilize our resources as a hands-on learning tool in technology and finance courses.
Contents of the Template
- Pre-Filled Data: Contains historical financial data and forecasts for Fujian Torch Electron Technology Co., Ltd. (603678SS).
- Discounted Cash Flow Model: An editable DCF valuation model equipped with automatic calculation features.
- Weighted Average Cost of Capital (WACC): A dedicated worksheet for WACC calculation using custom inputs.
- Key Financial Ratios: Evaluate Fujian Torch's profitability, efficiency, and financial leverage.
- Customizable Inputs: Easily modify revenue growth rates, profit margins, and tax rates.
- Clear Dashboard: Visual representations including charts and tables that highlight essential valuation outcomes.
Disclaimer
All information, articles, and product details provided on this website are for general informational and educational purposes only. We do not claim any ownership over, nor do we intend to infringe upon, any trademarks, copyrights, logos, brand names, or other intellectual property mentioned or depicted on this site. Such intellectual property remains the property of its respective owners, and any references here are made solely for identification or informational purposes, without implying any affiliation, endorsement, or partnership.
We make no representations or warranties, express or implied, regarding the accuracy, completeness, or suitability of any content or products presented. Nothing on this website should be construed as legal, tax, investment, financial, medical, or other professional advice. In addition, no part of this site—including articles or product references—constitutes a solicitation, recommendation, endorsement, advertisement, or offer to buy or sell any securities, franchises, or other financial instruments, particularly in jurisdictions where such activity would be unlawful.
All content is of a general nature and may not address the specific circumstances of any individual or entity. It is not a substitute for professional advice or services. Any actions you take based on the information provided here are strictly at your own risk. You accept full responsibility for any decisions or outcomes arising from your use of this website and agree to release us from any liability in connection with your use of, or reliance upon, the content or products found herein.