
|
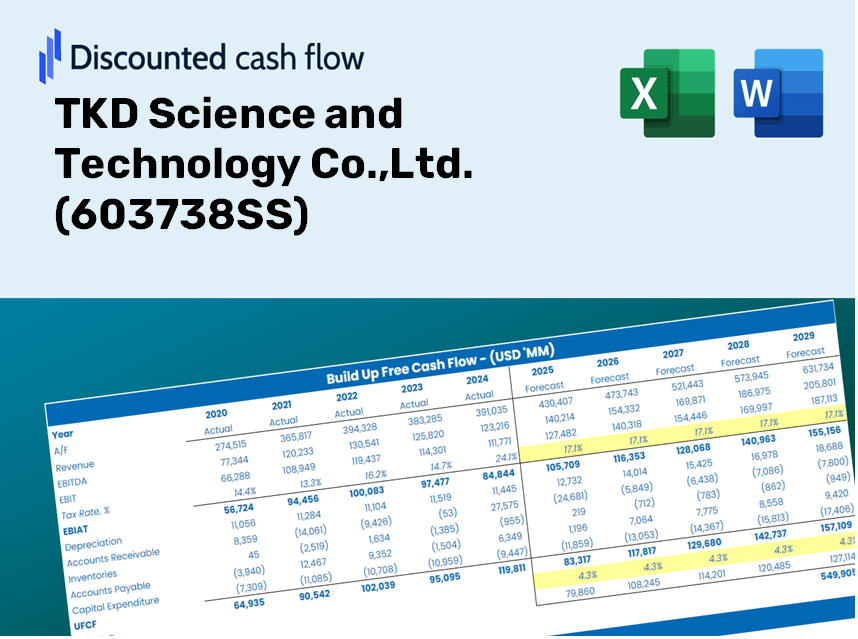
TKD Science and Technology Co.,Ltd. (603738.SS) DCF Valuation |
Fully Editable: Tailor To Your Needs In Excel Or Sheets
Professional Design: Trusted, Industry-Standard Templates
Investor-Approved Valuation Models
MAC/PC Compatible, Fully Unlocked
No Expertise Is Needed; Easy To Follow
TKD Science and Technology Co.,Ltd. (603738.SS) Bundle
Take charge of your TKD Science and Technology Co., Ltd. (603738SS) valuation analysis with our state-of-the-art DCF Calculator! This Excel template comes preloaded with real (603738SS) data, allowing you to adjust forecasts and assumptions to determine the intrinsic value of TKD Science and Technology Co., Ltd. with accuracy.
Discounted Cash Flow (DCF) - (USD MM)
| Year | AY1 2020 |
AY2 2021 |
AY3 2022 |
AY4 2023 |
AY5 2024 |
FY1 2025 |
FY2 2026 |
FY3 2027 |
FY4 2028 |
FY5 2029 |
|---|---|---|---|---|---|---|---|---|---|---|
| Revenue | 630.9 | 1,240.7 | 916.4 | 792.9 | 821.0 | 945.4 | 1,088.6 | 1,253.4 | 1,443.2 | 1,661.8 |
| Revenue Growth, % | 0 | 96.64 | -26.14 | -13.48 | 3.55 | 15.14 | 15.14 | 15.14 | 15.14 | 15.14 |
| EBITDA | 154.4 | 422.4 | 348.8 | 226.0 | 201.4 | 282.9 | 325.7 | 375.1 | 431.9 | 497.3 |
| EBITDA, % | 24.47 | 34.04 | 38.06 | 28.51 | 24.53 | 29.92 | 29.92 | 29.92 | 29.92 | 29.92 |
| Depreciation | 103.2 | 123.7 | 123.4 | 109.1 | 104.9 | 125.4 | 144.4 | 166.2 | 191.4 | 220.4 |
| Depreciation, % | 16.35 | 9.97 | 13.46 | 13.76 | 12.77 | 13.26 | 13.26 | 13.26 | 13.26 | 13.26 |
| EBIT | 51.2 | 298.7 | 225.4 | 117.0 | 96.5 | 157.5 | 181.4 | 208.8 | 240.4 | 276.9 |
| EBIT, % | 8.12 | 24.07 | 24.6 | 14.75 | 11.75 | 16.66 | 16.66 | 16.66 | 16.66 | 16.66 |
| Total Cash | 185.1 | 667.7 | 576.9 | 411.5 | 438.2 | 475.3 | 547.3 | 630.2 | 725.6 | 835.5 |
| Total Cash, percent | .0 | .0 | .0 | .0 | .0 | .0 | .0 | .0 | .0 | .0 |
| Account Receivables | 232.0 | 326.7 | 281.4 | 305.5 | 337.0 | 327.9 | 377.5 | 434.7 | 500.5 | 576.3 |
| Account Receivables, % | 36.78 | 26.34 | 30.71 | 38.53 | 41.05 | 34.68 | 34.68 | 34.68 | 34.68 | 34.68 |
| Inventories | 163.3 | 178.6 | 177.0 | 158.8 | 239.1 | 205.6 | 236.7 | 272.6 | 313.9 | 361.4 |
| Inventories, % | 25.88 | 14.39 | 19.31 | 20.03 | 29.12 | 21.75 | 21.75 | 21.75 | 21.75 | 21.75 |
| Accounts Payable | 119.4 | 144.9 | 76.9 | 110.2 | 152.4 | 135.1 | 155.5 | 179.1 | 206.2 | 237.5 |
| Accounts Payable, % | 18.92 | 11.68 | 8.39 | 13.9 | 18.56 | 14.29 | 14.29 | 14.29 | 14.29 | 14.29 |
| Capital Expenditure | -242.8 | -236.7 | -143.3 | -102.6 | -109.1 | -188.0 | -216.5 | -249.3 | -287.0 | -330.5 |
| Capital Expenditure, % | -38.49 | -19.08 | -15.64 | -12.95 | -13.29 | -19.89 | -19.89 | -19.89 | -19.89 | -19.89 |
| Tax Rate, % | 9.02 | 9.02 | 9.02 | 9.02 | 9.02 | 9.02 | 9.02 | 9.02 | 9.02 | 9.02 |
| EBITAT | 45.0 | 254.2 | 191.8 | 102.7 | 87.8 | 137.6 | 158.4 | 182.4 | 210.0 | 241.9 |
| Depreciation | ||||||||||
| Changes in Account Receivables | ||||||||||
| Changes in Inventories | ||||||||||
| Changes in Accounts Payable | ||||||||||
| Capital Expenditure | ||||||||||
| UFCF | -370.6 | 56.7 | 150.7 | 136.5 | 14.0 | 100.3 | 26.0 | 29.9 | 34.4 | 39.6 |
| WACC, % | 5.17 | 5.17 | 5.17 | 5.17 | 5.17 | 5.17 | 5.17 | 5.17 | 5.17 | 5.17 |
| PV UFCF | ||||||||||
| SUM PV UFCF | 203.6 | |||||||||
| Long Term Growth Rate, % | 4.00 | |||||||||
| Free cash flow (T + 1) | 41 | |||||||||
| Terminal Value | 3,533 | |||||||||
| Present Terminal Value | 2,747 | |||||||||
| Enterprise Value | 2,950 | |||||||||
| Net Debt | -175 | |||||||||
| Equity Value | 3,125 | |||||||||
| Diluted Shares Outstanding, MM | 381 | |||||||||
| Equity Value Per Share | 8.21 |
What You Will Receive
- Authentic TKD Financial Data: Pre-loaded with TKD’s historical and projected figures for accurate analysis.
- Fully Customizable Template: Effortlessly adjust key metrics such as revenue growth, WACC, and EBITDA percentage.
- Instant Calculations: Watch TKD’s intrinsic value refresh in real-time as you make adjustments.
- Professional Valuation Tool: Tailored for investors, analysts, and consultants in pursuit of precise DCF results.
- User-Friendly Interface: Clear layout and straightforward instructions suitable for all levels of expertise.
Key Features
- Comprehensive TKD Data: Pre-loaded with TKD Science and Technology's historical performance and future forecasts.
- Customizable Parameters: Tailor revenue growth, profit margins, discount rates, tax rates, and investment expenditures to your analysis.
- Interactive Valuation Model: Automatic recalculations of Net Present Value (NPV) and intrinsic value reflecting your input adjustments.
- Scenario Analysis: Develop various forecast scenarios to examine potential valuation results.
- User-Friendly Interface: Intuitive and well-organized, catering to both experienced professionals and newcomers.
How It Operates
- 1. Access the Template: Download and open the Excel file containing TKD Science and Technology Co., Ltd.'s preloaded data (603738SS).
- 2. Adjust Assumptions: Modify key variables such as growth rates, WACC, and capital expenditures to fit your analysis.
- 3. Instantly View Results: The DCF model automatically computes intrinsic value and NPV based on your inputs.
- 4. Explore Different Scenarios: Evaluate various forecasts to understand diverse valuation scenarios.
- 5. Utilize with Assurance: Deliver expert valuation insights to enhance your decision-making process.
Why Opt for Our Calculator?
- Designed for Experts: A sophisticated tool tailored for researchers, engineers, and tech consultants.
- Accurate Data: Comprehensive historical and projected financials for TKD Science and Technology Co., Ltd. (603738SS) included for precision.
- Flexible Scenario Analysis: Easily test various forecasts and assumptions to find the best outcomes.
- Concise Results: Instantly calculates intrinsic value, NPV, and other essential metrics.
- User-Friendly: Step-by-step guidance ensures you navigate the tool effortlessly.
Who Can Benefit from TKD Science and Technology Co., Ltd. ([603738SS])?
- Investors: Make informed choices with our advanced valuation tool designed for precision.
- Financial Analysts: Streamline your workflow with a ready-to-customize DCF model.
- Consultants: Effortlessly tailor the template for impactful client presentations or reports.
- Finance Enthusiasts: Enhance your knowledge of valuation methodologies through practical examples.
- Educators and Students: Utilize this resource as a hands-on learning aid in finance courses.
Contents of the Template
- Historical Data: Features TKD Science and Technology Co., Ltd.'s past financial performance and baseline projections.
- DCF and Levered DCF Models: Comprehensive templates for calculating the intrinsic value of TKD Science and Technology [603738SS].
- WACC Sheet: Pre-configured calculations for the Weighted Average Cost of Capital.
- Editable Inputs: Adjust essential drivers such as growth rates, EBITDA margins, and CAPEX assumptions.
- Quarterly and Annual Statements: A thorough breakdown of TKD Science and Technology's financial data.
- Interactive Dashboard: Visualize valuation outcomes and forecasts in an interactive format.
Disclaimer
All information, articles, and product details provided on this website are for general informational and educational purposes only. We do not claim any ownership over, nor do we intend to infringe upon, any trademarks, copyrights, logos, brand names, or other intellectual property mentioned or depicted on this site. Such intellectual property remains the property of its respective owners, and any references here are made solely for identification or informational purposes, without implying any affiliation, endorsement, or partnership.
We make no representations or warranties, express or implied, regarding the accuracy, completeness, or suitability of any content or products presented. Nothing on this website should be construed as legal, tax, investment, financial, medical, or other professional advice. In addition, no part of this site—including articles or product references—constitutes a solicitation, recommendation, endorsement, advertisement, or offer to buy or sell any securities, franchises, or other financial instruments, particularly in jurisdictions where such activity would be unlawful.
All content is of a general nature and may not address the specific circumstances of any individual or entity. It is not a substitute for professional advice or services. Any actions you take based on the information provided here are strictly at your own risk. You accept full responsibility for any decisions or outcomes arising from your use of this website and agree to release us from any liability in connection with your use of, or reliance upon, the content or products found herein.