
|
WG TECH Co., Ltd. (603773.SS) DCF Valuation |
Fully Editable: Tailor To Your Needs In Excel Or Sheets
Professional Design: Trusted, Industry-Standard Templates
Investor-Approved Valuation Models
MAC/PC Compatible, Fully Unlocked
No Expertise Is Needed; Easy To Follow
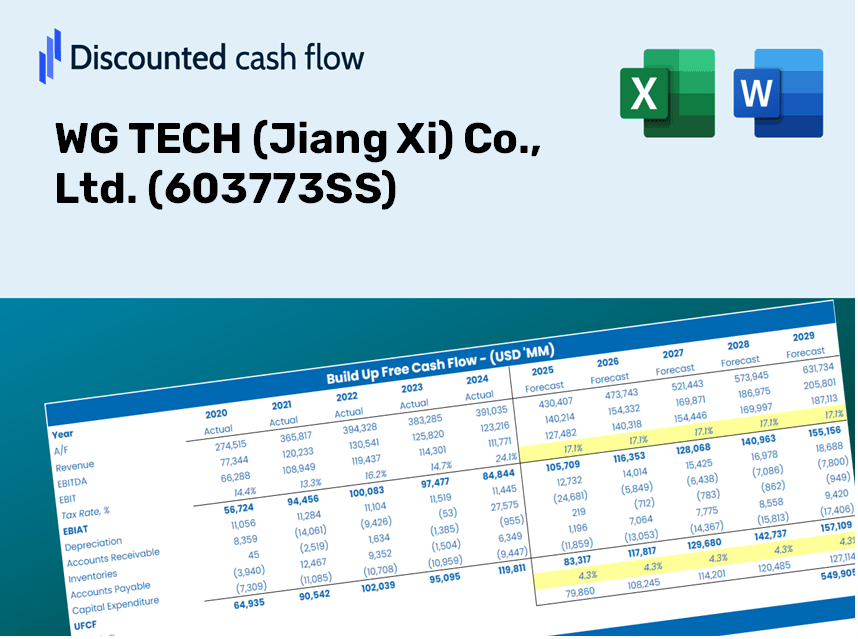
WG TECH (Jiang Xi) Co., Ltd. (603773.SS) Bundle
Explore the financial prospects of WG TECH (Jiang Xi) Co., Ltd. (603773SS) with our user-friendly DCF Calculator! Enter your assumptions for growth, margins, and costs to calculate the intrinsic value of WG TECH (Jiang Xi) Co., Ltd. (603773SS) and enhance your investment strategy.
Discounted Cash Flow (DCF) - (USD MM)
| Year | AY1 2020 |
AY2 2021 |
AY3 2022 |
AY4 2023 |
AY5 2024 |
FY1 2025 |
FY2 2026 |
FY3 2027 |
FY4 2028 |
FY5 2029 |
|---|---|---|---|---|---|---|---|---|---|---|
| Revenue | 604.2 | 1,050.0 | 1,397.8 | 1,813.6 | 2,220.8 | 3,104.3 | 4,339.2 | 6,065.3 | 8,478.1 | 11,850.7 |
| Revenue Growth, % | 0 | 73.79 | 33.12 | 29.75 | 22.45 | 39.78 | 39.78 | 39.78 | 39.78 | 39.78 |
| EBITDA | 91.0 | 112.5 | 59.0 | 167.3 | 121.6 | 277.6 | 388.0 | 542.4 | 758.1 | 1,059.7 |
| EBITDA, % | 15.07 | 10.72 | 4.22 | 9.23 | 5.48 | 8.94 | 8.94 | 8.94 | 8.94 | 8.94 |
| Depreciation | 87.7 | 114.4 | 124.4 | 130.1 | 137.4 | 296.0 | 413.7 | 578.3 | 808.4 | 1,129.9 |
| Depreciation, % | 14.52 | 10.89 | 8.9 | 7.18 | 6.19 | 9.53 | 9.53 | 9.53 | 9.53 | 9.53 |
| EBIT | 3.3 | -1.9 | -65.3 | 37.2 | -15.8 | -18.4 | -25.7 | -36.0 | -50.3 | -70.3 |
| EBIT, % | 0.54542 | -0.17636 | -4.67 | 2.05 | -0.71004 | -0.59285 | -0.59285 | -0.59285 | -0.59285 | -0.59285 |
| Total Cash | 475.3 | 298.3 | 385.8 | 706.8 | 796.3 | 1,300.8 | 1,818.3 | 2,541.6 | 3,552.6 | 4,965.9 |
| Total Cash, percent | .0 | .0 | .0 | .0 | .0 | .0 | .0 | .0 | .0 | .0 |
| Account Receivables | 275.5 | 597.2 | 1,036.8 | 1,028.4 | 1,156.7 | 1,772.2 | 2,477.2 | 3,462.6 | 4,840.1 | 6,765.5 |
| Account Receivables, % | 45.61 | 56.87 | 74.18 | 56.71 | 52.09 | 57.09 | 57.09 | 57.09 | 57.09 | 57.09 |
| Inventories | 21.8 | 136.3 | 120.8 | 139.6 | 122.9 | 238.8 | 333.8 | 466.6 | 652.2 | 911.7 |
| Inventories, % | 3.61 | 12.98 | 8.65 | 7.7 | 5.53 | 7.69 | 7.69 | 7.69 | 7.69 | 7.69 |
| Accounts Payable | 197.3 | 333.4 | 630.3 | 678.6 | 913.0 | 1,167.4 | 1,631.8 | 2,281.0 | 3,188.3 | 4,456.7 |
| Accounts Payable, % | 32.66 | 31.76 | 45.09 | 37.42 | 41.11 | 37.61 | 37.61 | 37.61 | 37.61 | 37.61 |
| Capital Expenditure | -226.4 | -218.9 | -229.4 | -361.1 | -392.8 | -697.5 | -974.9 | -1,362.7 | -1,904.8 | -2,662.6 |
| Capital Expenditure, % | -37.48 | -20.85 | -16.42 | -19.91 | -17.68 | -22.47 | -22.47 | -22.47 | -22.47 | -22.47 |
| Tax Rate, % | -102.07 | -102.07 | -102.07 | -102.07 | -102.07 | -102.07 | -102.07 | -102.07 | -102.07 | -102.07 |
| EBITAT | 2.3 | -5.4 | -75.6 | -4.6 | -31.9 | -13.6 | -19.0 | -26.6 | -37.2 | -52.0 |
| Depreciation | ||||||||||
| Changes in Account Receivables | ||||||||||
| Changes in Inventories | ||||||||||
| Changes in Accounts Payable | ||||||||||
| Capital Expenditure | ||||||||||
| UFCF | -236.4 | -409.9 | -308.1 | -197.7 | -164.4 | -892.1 | -915.8 | -1,280.1 | -1,789.4 | -2,501.2 |
| WACC, % | 4.15 | 4.35 | 4.35 | 3.66 | 4.35 | 4.17 | 4.17 | 4.17 | 4.17 | 4.17 |
| PV UFCF | ||||||||||
| SUM PV UFCF | -6,391.0 | |||||||||
| Long Term Growth Rate, % | 2.00 | |||||||||
| Free cash flow (T + 1) | -2,551 | |||||||||
| Terminal Value | -117,446 | |||||||||
| Present Terminal Value | -95,737 | |||||||||
| Enterprise Value | -102,128 | |||||||||
| Net Debt | 861 | |||||||||
| Equity Value | -102,988 | |||||||||
| Diluted Shares Outstanding, MM | 222 | |||||||||
| Equity Value Per Share | -462.92 |
Benefits You Will Receive
- Comprehensive Financial Model: Utilize WG TECH's real data for an accurate DCF valuation.
- Complete Forecasting Flexibility: Modify revenue growth rates, profit margins, WACC, and other critical factors.
- Real-Time Calculations: Automatic updates provide immediate results as you adjust inputs.
- Professional-Grade Template: A polished Excel file crafted for high-quality valuation analysis.
- Flexible and Reusable: Designed for customization, enabling multiple uses for in-depth forecasts.
Key Features
- Comprehensive Historical Data: WG TECH's (603773SS) past financial statements and pre-filled projections.
- Customizable Parameters: Adjust WACC, tax rates, revenue growth, and EBITDA margins to fit your analysis.
- Real-Time Insights: Observe the recalculation of WG TECH's intrinsic value instantly.
- Intuitive Visualizations: Dashboard graphs showcase valuation outcomes and important metrics clearly.
- Designed for Precision: A professional-grade tool tailored for analysts, investors, and financial professionals.
How It Functions
- Download the Template: Gain immediate access to the Excel-based WG TECH (603773SS) DCF Calculator.
- Input Your Assumptions: Modify the yellow-highlighted cells for growth rates, WACC, profit margins, and more.
- Instant Calculations: The model automatically recalculates WG TECH's intrinsic value.
- Test Scenarios: Experiment with different assumptions to assess potential changes in valuation.
- Analyze and Decide: Utilize the findings to inform your investment or financial evaluations.
Why Opt for WG TECH (Jiang Xi) Co., Ltd. (603773SS) Calculator?
- Time-Efficient: Eliminate the hassle of building a DCF model from the ground up – it's ready to go.
- Enhanced Accuracy: Dependable financial data and formulas minimize valuation errors.
- Fully Customizable: Adjust the model to align with your individual assumptions and forecasts.
- User-Friendly: Intuitive charts and outputs facilitate straightforward result interpretation.
- Expert-Endorsed: Crafted for professionals who prioritize precision and functionality.
Who Can Benefit from WG TECH (Jiang Xi) Co., Ltd. (603773SS)?
- Investors: Make informed decisions with our advanced valuation tool tailored for professionals.
- Financial Analysts: Streamline your workflow with our customizable DCF model, designed to save you time.
- Consultants: Effortlessly adjust the template for impactful client presentations and reports.
- Finance Enthusiasts: Enhance your knowledge of valuation methods through practical, real-world examples.
- Educators and Students: Utilize this resource as a hands-on learning tool in finance-focused curricula.
Contents of the Template
- Preloaded WG TECH (603773SS) Data: Historical and projected financial metrics, including revenue, EBIT, and capital expenditures.
- DCF and WACC Models: High-quality spreadsheets for calculating intrinsic value and the Weighted Average Cost of Capital.
- Editable Inputs: Yellow-highlighted fields for modifying revenue growth rates, tax rates, and discount rates.
- Financial Statements: Detailed annual and quarterly financial reports for in-depth analysis.
- Key Ratios: Metrics for profitability, leverage, and efficiency to assess overall performance.
- Dashboard and Charts: Visual representations of valuation results and underlying assumptions.
Disclaimer
All information, articles, and product details provided on this website are for general informational and educational purposes only. We do not claim any ownership over, nor do we intend to infringe upon, any trademarks, copyrights, logos, brand names, or other intellectual property mentioned or depicted on this site. Such intellectual property remains the property of its respective owners, and any references here are made solely for identification or informational purposes, without implying any affiliation, endorsement, or partnership.
We make no representations or warranties, express or implied, regarding the accuracy, completeness, or suitability of any content or products presented. Nothing on this website should be construed as legal, tax, investment, financial, medical, or other professional advice. In addition, no part of this site—including articles or product references—constitutes a solicitation, recommendation, endorsement, advertisement, or offer to buy or sell any securities, franchises, or other financial instruments, particularly in jurisdictions where such activity would be unlawful.
All content is of a general nature and may not address the specific circumstances of any individual or entity. It is not a substitute for professional advice or services. Any actions you take based on the information provided here are strictly at your own risk. You accept full responsibility for any decisions or outcomes arising from your use of this website and agree to release us from any liability in connection with your use of, or reliance upon, the content or products found herein.