
|
KEBODA TECHNOLOGY Co., Ltd. (603786.SS) DCF Valuation |
Fully Editable: Tailor To Your Needs In Excel Or Sheets
Professional Design: Trusted, Industry-Standard Templates
Investor-Approved Valuation Models
MAC/PC Compatible, Fully Unlocked
No Expertise Is Needed; Easy To Follow
KEBODA TECHNOLOGY Co., Ltd. (603786.SS) Bundle
Explore the financial future of KEBODA TECHNOLOGY Co., Ltd. (603786SS) with our user-friendly DCF Calculator! Enter your assumptions for growth, margins, and costs to calculate the intrinsic value of KEBODA TECHNOLOGY Co., Ltd. (603786SS) and enhance your investment strategy.
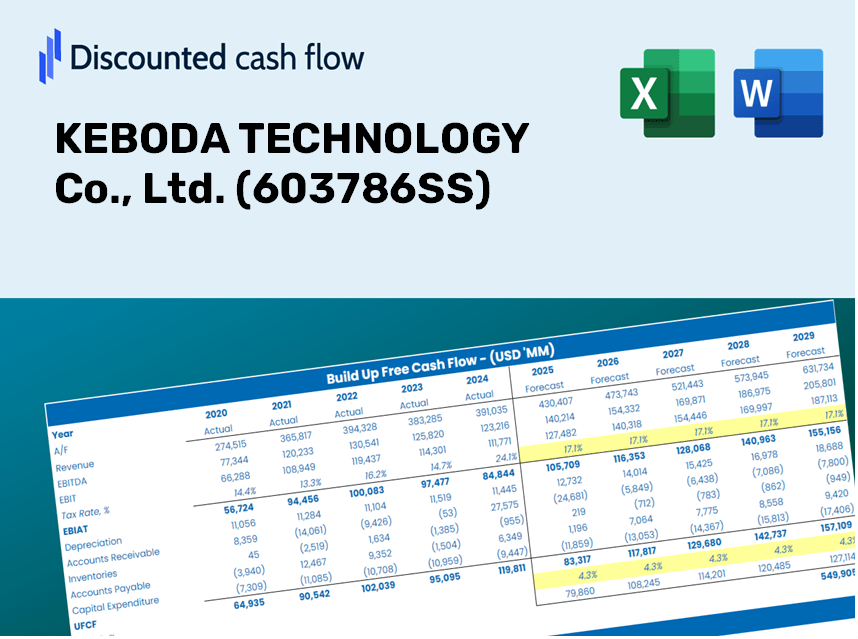
Discounted Cash Flow (DCF) - (USD MM)
| Year | AY1 2020 |
AY2 2021 |
AY3 2022 |
AY4 2023 |
AY5 2024 |
FY1 2025 |
FY2 2026 |
FY3 2027 |
FY4 2028 |
FY5 2029 |
|---|---|---|---|---|---|---|---|---|---|---|
| Revenue | 2,913.7 | 2,806.5 | 3,383.9 | 4,625.1 | 5,967.9 | 7,200.4 | 8,687.4 | 10,481.4 | 12,646.0 | 15,257.6 |
| Revenue Growth, % | 0 | -3.68 | 20.57 | 36.68 | 29.03 | 20.65 | 20.65 | 20.65 | 20.65 | 20.65 |
| EBITDA | 657.2 | 502.3 | 543.9 | 672.6 | 962.1 | 1,255.6 | 1,514.9 | 1,827.8 | 2,205.3 | 2,660.7 |
| EBITDA, % | 22.56 | 17.9 | 16.07 | 14.54 | 16.12 | 17.44 | 17.44 | 17.44 | 17.44 | 17.44 |
| Depreciation | 101.6 | 102.5 | 115.8 | 139.6 | 149.3 | 231.6 | 279.4 | 337.2 | 406.8 | 490.8 |
| Depreciation, % | 3.49 | 3.65 | 3.42 | 3.02 | 2.5 | 3.22 | 3.22 | 3.22 | 3.22 | 3.22 |
| EBIT | 555.6 | 399.8 | 428.0 | 533.1 | 812.8 | 1,024.0 | 1,235.5 | 1,490.6 | 1,798.5 | 2,169.9 |
| EBIT, % | 19.07 | 14.24 | 12.65 | 11.53 | 13.62 | 14.22 | 14.22 | 14.22 | 14.22 | 14.22 |
| Total Cash | 1,481.8 | 1,427.0 | 1,221.7 | 1,599.6 | 1,616.2 | 2,872.5 | 3,465.8 | 4,181.5 | 5,045.1 | 6,086.9 |
| Total Cash, percent | .0 | .0 | .0 | .0 | .0 | .0 | .0 | .0 | .0 | .0 |
| Account Receivables | 1,230.5 | 912.5 | 1,395.3 | 1,909.4 | 2,257.1 | 2,809.3 | 3,389.5 | 4,089.5 | 4,934.0 | 5,953.0 |
| Account Receivables, % | 42.23 | 32.52 | 41.23 | 41.28 | 37.82 | 39.02 | 39.02 | 39.02 | 39.02 | 39.02 |
| Inventories | 680.8 | 999.9 | 1,229.6 | 1,345.6 | 1,560.9 | 2,168.5 | 2,616.3 | 3,156.6 | 3,808.5 | 4,595.0 |
| Inventories, % | 23.37 | 35.63 | 36.34 | 29.09 | 26.16 | 30.12 | 30.12 | 30.12 | 30.12 | 30.12 |
| Accounts Payable | 421.2 | 327.6 | 419.3 | 587.3 | 451.4 | 846.5 | 1,021.3 | 1,232.2 | 1,486.7 | 1,793.7 |
| Accounts Payable, % | 14.46 | 11.67 | 12.39 | 12.7 | 7.56 | 11.76 | 11.76 | 11.76 | 11.76 | 11.76 |
| Capital Expenditure | -102.5 | -172.3 | -213.9 | -390.1 | -237.5 | -408.9 | -493.3 | -595.2 | -718.1 | -866.4 |
| Capital Expenditure, % | -3.52 | -6.14 | -6.32 | -8.44 | -3.98 | -5.68 | -5.68 | -5.68 | -5.68 | -5.68 |
| Tax Rate, % | 14.74 | 14.74 | 14.74 | 14.74 | 14.74 | 14.74 | 14.74 | 14.74 | 14.74 | 14.74 |
| EBITAT | 438.0 | 335.6 | 340.3 | 467.4 | 693.0 | 850.4 | 1,026.0 | 1,237.9 | 1,493.6 | 1,802.0 |
| Depreciation | ||||||||||
| Changes in Account Receivables | ||||||||||
| Changes in Inventories | ||||||||||
| Changes in Accounts Payable | ||||||||||
| Capital Expenditure | ||||||||||
| UFCF | -1,053.0 | 171.2 | -378.5 | -245.3 | -94.1 | -91.5 | -41.0 | -49.5 | -59.7 | -72.0 |
| WACC, % | 9.54 | 9.54 | 9.54 | 9.54 | 9.54 | 9.54 | 9.54 | 9.54 | 9.54 | 9.54 |
| PV UFCF | ||||||||||
| SUM PV UFCF | -242.6 | |||||||||
| Long Term Growth Rate, % | 4.00 | |||||||||
| Free cash flow (T + 1) | -75 | |||||||||
| Terminal Value | -1,352 | |||||||||
| Present Terminal Value | -857 | |||||||||
| Enterprise Value | -1,100 | |||||||||
| Net Debt | -502 | |||||||||
| Equity Value | -598 | |||||||||
| Diluted Shares Outstanding, MM | 406 | |||||||||
| Equity Value Per Share | -1.47 |
What You Will Receive
- Real KEBODA Financial Data: Pre-filled with KEBODA's historical and projected data for accurate analysis.
- Fully Customizable Template: Easily adjust key inputs such as revenue growth, WACC, and EBITDA %.
- Automatic Updates: Instantly view KEBODA's intrinsic value as you make adjustments.
- Professional Valuation Tool: Crafted for investors, analysts, and consultants aiming for precise DCF outcomes.
- User-Friendly Interface: Clear layout and straightforward instructions for users of all skill levels.
Key Features
- Customizable Forecast Inputs: Adjust essential parameters such as revenue growth, EBITDA percentage, and capital expenditures.
- Instant DCF Valuation: Provides immediate calculations for intrinsic value, NPV, and other financial metrics.
- High Precision Accuracy: Leverages KEBODA TECHNOLOGY's actual financials for dependable valuation results.
- Simplified Scenario Analysis: Easily evaluate various assumptions and analyze different outcomes side by side.
- Efficient Valuation Tool: Avoid the hassle of constructing intricate valuation models from the ground up.
How It Works
- Download: Retrieve the ready-to-use Excel file containing KEBODA TECHNOLOGY Co., Ltd.’s (603786SS) financial data.
- Customize: Tailor your forecasts, including revenue growth, EBITDA %, and WACC to fit your analysis.
- Update Automatically: Watch as intrinsic value and NPV calculations refresh in real-time.
- Test Scenarios: Develop various projections and instantly compare their outcomes.
- Make Decisions: Utilize the valuation results to inform your investment strategy with KEBODA TECHNOLOGY Co., Ltd. (603786SS).
Why Select KEBODA TECHNOLOGY Co., Ltd. (603786SS) Calculator?
- Precision: Utilizes authentic KEBODA financial data for reliable results.
- Versatility: Built to allow users to easily test and adjust inputs as needed.
- Efficiency: Eliminate the need to create a financial model from the ground up.
- Expert-Level: Crafted with the expertise and usability expected from top financial officers.
- Intuitive Design: Simple to navigate, suitable for users with varying degrees of financial modeling skills.
Who Could Benefit from KEBODA TECHNOLOGY Co., Ltd. (603786SS)?
- Investors: Assess KEBODA's market value prior to making investment decisions.
- CFOs and Financial Analysts: Optimize valuation procedures and evaluate financial forecasts.
- Startup Founders: Understand the valuation methods applied to established tech companies like KEBODA.
- Consultants: Provide detailed valuation analyses and reports for clients in the tech sector.
- Students and Educators: Utilize KEBODA’s data for hands-on practice and teaching of valuation strategies.
What the KEBODA TECHNOLOGY Template Includes
- Detailed DCF Model: An editable template featuring comprehensive valuation calculations.
- Actual Financial Data: Historical and projected financial figures for KEBODA TECHNOLOGY (603786SS) preloaded for in-depth analysis.
- Adjustable Parameters: Modify WACC, growth rates, and tax assumptions to explore various scenarios.
- Financial Statements: Complete annual and quarterly reports for enhanced understanding.
- Essential Ratios: Integrated analysis for profitability, efficiency, and leverage ratios.
- Visual Dashboard: Charts and tables that present clear, actionable insights.
Disclaimer
All information, articles, and product details provided on this website are for general informational and educational purposes only. We do not claim any ownership over, nor do we intend to infringe upon, any trademarks, copyrights, logos, brand names, or other intellectual property mentioned or depicted on this site. Such intellectual property remains the property of its respective owners, and any references here are made solely for identification or informational purposes, without implying any affiliation, endorsement, or partnership.
We make no representations or warranties, express or implied, regarding the accuracy, completeness, or suitability of any content or products presented. Nothing on this website should be construed as legal, tax, investment, financial, medical, or other professional advice. In addition, no part of this site—including articles or product references—constitutes a solicitation, recommendation, endorsement, advertisement, or offer to buy or sell any securities, franchises, or other financial instruments, particularly in jurisdictions where such activity would be unlawful.
All content is of a general nature and may not address the specific circumstances of any individual or entity. It is not a substitute for professional advice or services. Any actions you take based on the information provided here are strictly at your own risk. You accept full responsibility for any decisions or outcomes arising from your use of this website and agree to release us from any liability in connection with your use of, or reliance upon, the content or products found herein.