
|
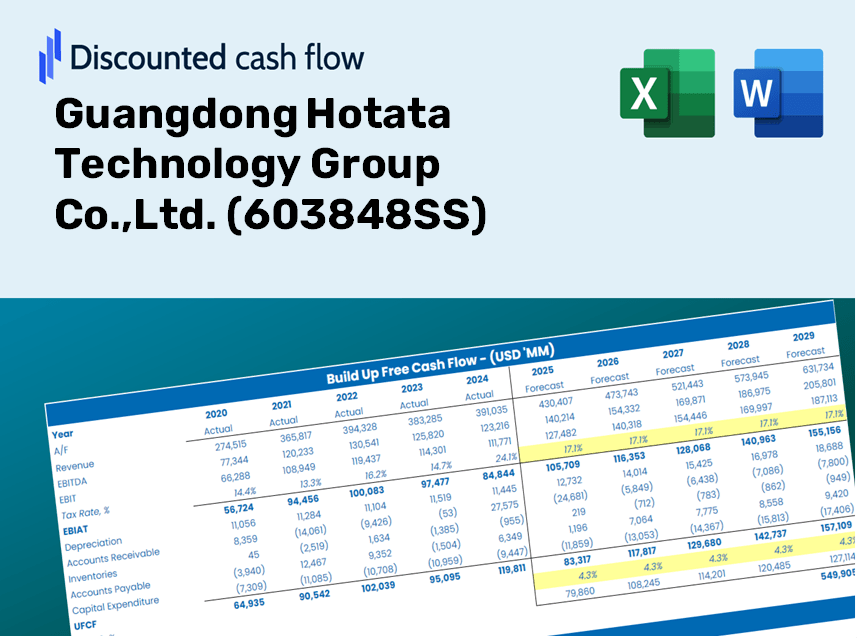
Guangdong Hotata Technology Group Co.,Ltd. (603848.SS) DCF Valuation |
Fully Editable: Tailor To Your Needs In Excel Or Sheets
Professional Design: Trusted, Industry-Standard Templates
Investor-Approved Valuation Models
MAC/PC Compatible, Fully Unlocked
No Expertise Is Needed; Easy To Follow
Guangdong Hotata Technology Group Co.,Ltd. (603848.SS) Bundle
Discover the true value of Guangdong Hotata Technology Group Co., Ltd. with our professional-grade DCF Calculator! Adjust key assumptions, explore various scenarios, and evaluate how changes affect Guangdong Hotata Technology Group Co., Ltd.'s valuation – all within a single Excel template.
Discounted Cash Flow (DCF) - (USD MM)
| Year | AY1 2020 |
AY2 2021 |
AY3 2022 |
AY4 2023 |
AY5 2024 |
FY1 2025 |
FY2 2026 |
FY3 2027 |
FY4 2028 |
FY5 2029 |
|---|---|---|---|---|---|---|---|---|---|---|
| Revenue | 1,160.0 | 1,425.4 | 1,382.0 | 1,688.3 | 1,556.9 | 1,723.6 | 1,908.0 | 2,112.2 | 2,338.3 | 2,588.5 |
| Revenue Growth, % | 0 | 22.88 | -3.05 | 22.16 | -7.78 | 10.7 | 10.7 | 10.7 | 10.7 | 10.7 |
| EBITDA | 276.8 | 341.6 | 264.4 | 398.5 | 338.9 | 387.2 | 428.6 | 474.5 | 525.3 | 581.5 |
| EBITDA, % | 23.86 | 23.97 | 19.13 | 23.6 | 21.77 | 22.47 | 22.47 | 22.47 | 22.47 | 22.47 |
| Depreciation | 17.0 | 19.3 | 22.5 | 35.1 | 67.8 | 37.5 | 41.5 | 45.9 | 50.8 | 56.3 |
| Depreciation, % | 1.46 | 1.36 | 1.63 | 2.08 | 4.35 | 2.17 | 2.17 | 2.17 | 2.17 | 2.17 |
| EBIT | 259.8 | 322.3 | 241.9 | 363.5 | 271.2 | 349.7 | 387.2 | 428.6 | 474.5 | 525.2 |
| EBIT, % | 22.4 | 22.61 | 17.5 | 21.53 | 17.42 | 20.29 | 20.29 | 20.29 | 20.29 | 20.29 |
| Total Cash | 1,045.2 | 1,144.6 | 124.1 | 380.6 | 373.0 | 778.6 | 862.0 | 954.2 | 1,056.3 | 1,169.4 |
| Total Cash, percent | .0 | .0 | .0 | .0 | .0 | .0 | .0 | .0 | .0 | .0 |
| Account Receivables | 115.7 | 126.7 | 108.5 | 102.2 | 76.9 | 130.0 | 143.9 | 159.3 | 176.3 | 195.2 |
| Account Receivables, % | 9.97 | 8.89 | 7.85 | 6.05 | 4.94 | 7.54 | 7.54 | 7.54 | 7.54 | 7.54 |
| Inventories | 91.5 | 196.5 | 196.6 | 158.0 | 149.5 | 189.1 | 209.4 | 231.8 | 256.6 | 284.0 |
| Inventories, % | 7.89 | 13.78 | 14.22 | 9.36 | 9.6 | 10.97 | 10.97 | 10.97 | 10.97 | 10.97 |
| Accounts Payable | 310.4 | 173.7 | 111.3 | 295.0 | 275.3 | 283.2 | 313.5 | 347.1 | 384.2 | 425.4 |
| Accounts Payable, % | 26.76 | 12.19 | 8.06 | 17.47 | 17.68 | 16.43 | 16.43 | 16.43 | 16.43 | 16.43 |
| Capital Expenditure | -98.6 | -130.2 | -1,466.0 | -109.5 | -225.3 | -477.8 | -528.9 | -585.5 | -648.2 | -717.5 |
| Capital Expenditure, % | -8.5 | -9.14 | -106.07 | -6.49 | -14.47 | -27.72 | -27.72 | -27.72 | -27.72 | -27.72 |
| Tax Rate, % | 13.65 | 13.65 | 13.65 | 13.65 | 13.65 | 13.65 | 13.65 | 13.65 | 13.65 | 13.65 |
| EBITAT | 225.7 | 274.2 | 211.4 | 315.0 | 234.2 | 302.4 | 334.7 | 370.6 | 410.2 | 454.1 |
| Depreciation | ||||||||||
| Changes in Account Receivables | ||||||||||
| Changes in Inventories | ||||||||||
| Changes in Accounts Payable | ||||||||||
| Capital Expenditure | ||||||||||
| UFCF | 247.2 | -89.5 | -1,276.3 | 469.1 | 90.7 | -222.7 | -156.5 | -173.2 | -191.8 | -212.3 |
| WACC, % | 4.63 | 4.63 | 4.63 | 4.63 | 4.63 | 4.63 | 4.63 | 4.63 | 4.63 | 4.63 |
| PV UFCF | ||||||||||
| SUM PV UFCF | -836.3 | |||||||||
| Long Term Growth Rate, % | 3.00 | |||||||||
| Free cash flow (T + 1) | -219 | |||||||||
| Terminal Value | -13,386 | |||||||||
| Present Terminal Value | -10,673 | |||||||||
| Enterprise Value | -11,509 | |||||||||
| Net Debt | -149 | |||||||||
| Equity Value | -11,360 | |||||||||
| Diluted Shares Outstanding, MM | 401 | |||||||||
| Equity Value Per Share | -28.34 |
What You Will Receive
- Authentic Guangdong Hotata Data: Comprehensive financial information – covering everything from revenue to EBIT – derived from real and forecasted figures.
- Complete Customization: Modify all essential parameters (yellow cells) including WACC, growth rates, and tax percentages.
- Immediate Valuation Adjustments: Automatic updates that allow you to assess the effects of changes on Guangdong Hotata’s fair value.
- Flexible Excel Template: Designed for quick modifications, scenario analysis, and thorough projections.
- Efficient and Precise: Avoid the hassle of constructing models from the ground up while ensuring accuracy and adaptability.
Key Features
- Comprehensive DCF Calculator: Features detailed unlevered and levered DCF valuation models tailored for Guangdong Hotata Technology Group Co., Ltd. (603848SS).
- WACC Calculator: Pre-configured Weighted Average Cost of Capital sheet with adjustable parameters.
- Customizable Forecast Assumptions: Update growth projections, capital expenditures, and discount rates as needed.
- Integrated Financial Ratios: Assess profitability, leverage, and efficiency ratios specific to Guangdong Hotata Technology Group Co., Ltd. (603848SS).
- Interactive Dashboard and Charts: Visual representations highlight key valuation metrics for streamlined analysis.
How It Works
- Download: Get the ready-to-use Excel file containing Guangdong Hotata Technology Group Co., Ltd.'s (603848SS) financial data.
- Customize: Modify forecasts such as revenue growth, EBITDA %, and WACC to fit your analysis.
- Update Automatically: Watch as intrinsic value and NPV calculations refresh in real-time.
- Test Scenarios: Generate various projections and instantly compare the results.
- Make Decisions: Leverage the valuation outcomes to inform your investment choices.
Why Choose Guangdong Hotata Technology Group Co., Ltd. (603848SS)?
- Time Efficient: Skip the hassle of building from the ground up – our solutions are ready to go.
- Enhanced Precision: Our dependable financial data and formulas minimize valuation errors.
- Completely Customizable: Adjust the model to match your unique assumptions and forecasts.
- User-Friendly: Intuitive charts and outputs simplify the analysis of results.
- Endorsed by Professionals: Crafted for experts who prioritize accuracy and ease of use.
Who Should Use This Product?
- Individual Investors: Make informed choices regarding the buying or selling of Guangdong Hotata Technology Group Co.,Ltd. (603848SS).
- Financial Analysts: Enhance valuation processes with pre-built financial models tailored for Guangdong Hotata Technology Group Co.,Ltd. (603848SS).
- Consultants: Provide clients with professional valuation insights on Guangdong Hotata Technology Group Co.,Ltd. (603848SS) quickly and accurately.
- Business Owners: Gain an understanding of how large corporations like Guangdong Hotata Technology Group Co.,Ltd. (603848SS) are valued to inform your own business strategies.
- Finance Students: Study valuation techniques using real-world data and case studies related to Guangdong Hotata Technology Group Co.,Ltd. (603848SS).
Contents of the Template
- Pre-Filled DCF Model: Guangdong Hotata Technology Group Co., Ltd.’s financial data preloaded for immediate analysis.
- WACC Calculator: Comprehensive calculations for the Weighted Average Cost of Capital.
- Financial Ratios: Assess Guangdong Hotata's profitability, leverage, and efficiency metrics.
- Editable Inputs: Modify assumptions such as growth rates, margins, and CAPEX to suit your specific scenarios.
- Financial Statements: Access annual and quarterly reports for in-depth analysis.
- Interactive Dashboard: Effortlessly visualize key valuation metrics and outcomes.
Disclaimer
All information, articles, and product details provided on this website are for general informational and educational purposes only. We do not claim any ownership over, nor do we intend to infringe upon, any trademarks, copyrights, logos, brand names, or other intellectual property mentioned or depicted on this site. Such intellectual property remains the property of its respective owners, and any references here are made solely for identification or informational purposes, without implying any affiliation, endorsement, or partnership.
We make no representations or warranties, express or implied, regarding the accuracy, completeness, or suitability of any content or products presented. Nothing on this website should be construed as legal, tax, investment, financial, medical, or other professional advice. In addition, no part of this site—including articles or product references—constitutes a solicitation, recommendation, endorsement, advertisement, or offer to buy or sell any securities, franchises, or other financial instruments, particularly in jurisdictions where such activity would be unlawful.
All content is of a general nature and may not address the specific circumstances of any individual or entity. It is not a substitute for professional advice or services. Any actions you take based on the information provided here are strictly at your own risk. You accept full responsibility for any decisions or outcomes arising from your use of this website and agree to release us from any liability in connection with your use of, or reliance upon, the content or products found herein.