
|
Toyota Industries Corporation (6201.T) DCF Valuation |
Fully Editable: Tailor To Your Needs In Excel Or Sheets
Professional Design: Trusted, Industry-Standard Templates
Investor-Approved Valuation Models
MAC/PC Compatible, Fully Unlocked
No Expertise Is Needed; Easy To Follow
Toyota Industries Corporation (6201.T) Bundle
Discover the true value of Toyota Industries Corporation (6201T) with our professional-grade DCF Calculator! Adjust key assumptions, explore various scenarios, and assess how changes affect Toyota Industries Corporation (6201T) valuation – all within a single Excel template.
Discounted Cash Flow (DCF) - (USD MM)
| Year | AY1 2021 |
AY2 2022 |
AY3 2023 |
AY4 2024 |
AY5 2025 |
FY1 2026 |
FY2 2027 |
FY3 2028 |
FY4 2029 |
FY5 2030 |
|---|---|---|---|---|---|---|---|---|---|---|
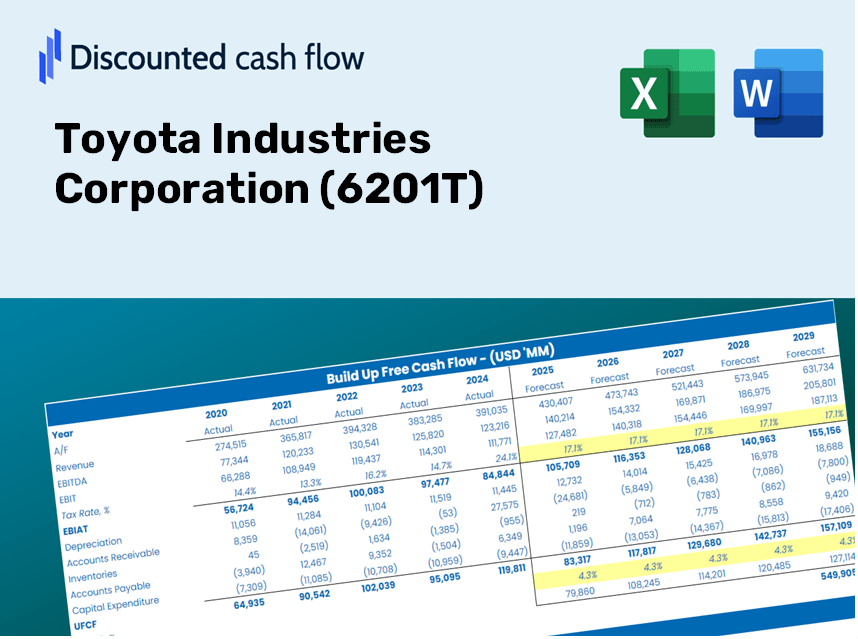
| Revenue | 2,118,302.0 | 2,705,183.0 | 3,379,891.0 | 3,833,205.0 | 4,084,984.0 | 4,826,684.5 | 5,703,053.8 | 6,738,543.4 | 7,962,044.2 | 9,407,693.0 |
| Revenue Growth, % | 0 | 27.71 | 24.94 | 13.41 | 6.57 | 18.16 | 18.16 | 18.16 | 18.16 | 18.16 |
| EBITDA | 403,680.0 | 477,142.0 | 534,705.0 | 615,520.0 | 367,332.0 | 748,762.2 | 884,713.1 | 1,045,348.3 | 1,235,149.6 | 1,459,412.7 |
| EBITDA, % | 19.06 | 17.64 | 15.82 | 16.06 | 8.99 | 15.51 | 15.51 | 15.51 | 15.51 | 15.51 |
| Depreciation | 209,839.0 | 223,737.0 | 257,762.0 | 284,939.0 | 324,055.0 | 397,422.4 | 469,581.4 | 554,842.1 | 655,583.5 | 774,616.2 |
| Depreciation, % | 9.91 | 8.27 | 7.63 | 7.43 | 7.93 | 8.23 | 8.23 | 8.23 | 8.23 | 8.23 |
| EBIT | 193,841.0 | 253,405.0 | 276,943.0 | 330,581.0 | 43,277.0 | 351,339.8 | 415,131.7 | 490,506.2 | 579,566.2 | 684,796.6 |
| EBIT, % | 9.15 | 9.37 | 8.19 | 8.62 | 1.06 | 7.28 | 7.28 | 7.28 | 7.28 | 7.28 |
| Total Cash | 598,059.0 | 588,431.0 | 628,303.0 | 740,207.0 | 468,202.0 | 959,026.6 | 1,133,154.7 | 1,338,898.8 | 1,581,999.4 | 1,869,239.1 |
| Total Cash, percent | .0 | .0 | .0 | .0 | .0 | .0 | .0 | .0 | .0 | .0 |
| Account Receivables | 962,270.0 | 1,121,491.0 | 1,398,757.0 | 1,638,998.0 | 1,720,610.0 | 2,057,582.2 | 2,431,172.4 | 2,872,594.4 | 3,394,164.3 | 4,010,434.4 |
| Account Receivables, % | 45.43 | 41.46 | 41.38 | 42.76 | 42.12 | 42.63 | 42.63 | 42.63 | 42.63 | 42.63 |
| Inventories | 292,461.0 | 433,961.0 | 524,385.0 | 619,082.0 | 619,804.0 | 740,281.3 | 874,692.4 | 1,033,508.2 | 1,221,159.7 | 1,442,882.7 |
| Inventories, % | 13.81 | 16.04 | 15.51 | 16.15 | 15.17 | 15.34 | 15.34 | 15.34 | 15.34 | 15.34 |
| Accounts Payable | 613,579.0 | 745,553.0 | 807,474.0 | 876,925.0 | 878,848.0 | 1,204,812.8 | 1,423,567.7 | 1,682,041.4 | 1,987,445.5 | 2,348,301.1 |
| Accounts Payable, % | 28.97 | 27.56 | 23.89 | 22.88 | 21.51 | 24.96 | 24.96 | 24.96 | 24.96 | 24.96 |
| Capital Expenditure | -222,360.0 | -237,371.0 | -289,974.0 | -348,926.0 | -211,032.0 | -406,599.1 | -480,424.3 | -567,653.7 | -670,721.2 | -792,502.5 |
| Capital Expenditure, % | -10.5 | -8.77 | -8.58 | -9.1 | -5.17 | -8.42 | -8.42 | -8.42 | -8.42 | -8.42 |
| Tax Rate, % | 25.37 | 25.37 | 25.37 | 25.37 | 25.37 | 25.37 | 25.37 | 25.37 | 25.37 | 25.37 |
| EBITAT | 144,002.6 | 185,640.7 | 203,111.1 | 244,606.6 | 32,299.5 | 259,650.8 | 306,794.9 | 362,498.9 | 428,317.0 | 506,085.4 |
| Depreciation | ||||||||||
| Changes in Account Receivables | ||||||||||
| Changes in Inventories | ||||||||||
| Changes in Accounts Payable | ||||||||||
| Capital Expenditure | ||||||||||
| UFCF | -509,670.4 | 3,259.7 | -134,869.9 | -84,867.4 | 64,911.5 | 118,989.3 | 6,705.7 | 7,923.2 | 9,361.8 | 11,061.6 |
| WACC, % | 5.58 | 5.57 | 5.57 | 5.58 | 5.58 | 5.58 | 5.58 | 5.58 | 5.58 | 5.58 |
| PV UFCF | ||||||||||
| SUM PV UFCF | 141,422.8 | |||||||||
| Long Term Growth Rate, % | 3.00 | |||||||||
| Free cash flow (T + 1) | 11,393 | |||||||||
| Terminal Value | 442,328 | |||||||||
| Present Terminal Value | 337,227 | |||||||||
| Enterprise Value | 478,650 | |||||||||
| Net Debt | 1,351,627 | |||||||||
| Equity Value | -872,977 | |||||||||
| Diluted Shares Outstanding, MM | 306 | |||||||||
| Equity Value Per Share | -2,851.97 |
What You Will Receive
- Genuine 6201T Financial Data: Offers both historical and projected figures for thorough valuation.
- Customizable Parameters: Adjust WACC, tax rates, revenue growth, and capital expenditures to fit your analysis.
- Automated Calculations: Intrinsic value and NPV are computed in real-time.
- Scenario Analysis: Explore various scenarios to assess Toyota Industries Corporation’s future outlook.
- User-Friendly and Professional Design: Designed for experts while remaining approachable for newcomers.
Key Features
- Comprehensive DCF Calculator: Features both unlevered and levered DCF valuation models tailored for Toyota Industries Corporation (6201T).
- WACC Calculator: A pre-configured Weighted Average Cost of Capital tool with adjustable inputs.
- Customizable Forecast Assumptions: Adjust growth rates, capital expenditures, and discount rates as needed.
- Integrated Financial Ratios: Evaluate profitability, leverage, and efficiency ratios specific to Toyota Industries Corporation (6201T).
- User-Friendly Dashboard and Charts: Visual representations of key valuation metrics for straightforward analysis.
How It Functions
- Download the Template: Gain immediate access to the Excel-based Toyota Industries Corporation (6201T) DCF Calculator.
- Input Your Assumptions: Modify the yellow-highlighted cells for growth rates, WACC, margins, and other factors.
- Instant Calculations: The model dynamically recalculates Toyota Industries Corporation’s intrinsic value.
- Test Scenarios: Experiment with different assumptions to assess potential changes in valuation.
- Analyze and Decide: Utilize the results to inform your investment or financial analysis.
Why Select This Calculator?
- All-in-One Solution: Combines DCF, WACC, and financial ratio analyses in a single tool.
- Flexible Inputs: Modify yellow-highlighted fields to explore different scenarios.
- In-Depth Analysis: Automatically computes the intrinsic value and Net Present Value for Toyota Industries Corporation (6201T).
- Pre-Filled Data: Access to historical and projected data sets the stage for accurate assessments.
- High-Quality Standards: Perfect for financial analysts, investors, and business advisors.
Who Is This Product For?
- Investors: Accurately assess Toyota Industries Corporation’s fair value prior to making investment choices.
- CFOs: Utilize a professional-grade DCF model for comprehensive financial reporting and analysis.
- Consultants: Seamlessly customize the template for valuation reports tailored to clients.
- Entrepreneurs: Acquire knowledge of financial modeling techniques employed by leading corporations.
- Educators: Implement it as a teaching resource to illustrate valuation approaches.
What the Template Contains
- Historical Data: Provides Toyota Industries Corporation's past financial performance and foundational forecasts.
- DCF and Levered DCF Models: Comprehensive templates for determining the intrinsic value of Toyota Industries Corporation (6201T).
- WACC Sheet: Pre-configured calculations for the Weighted Average Cost of Capital.
- Editable Inputs: Adjust crucial drivers such as growth rates, EBITDA margins, and CAPEX assumptions.
- Quarterly and Annual Statements: A thorough analysis of Toyota Industries Corporation's financials.
- Interactive Dashboard: Dynamically visualize valuation outcomes and projections.
Disclaimer
All information, articles, and product details provided on this website are for general informational and educational purposes only. We do not claim any ownership over, nor do we intend to infringe upon, any trademarks, copyrights, logos, brand names, or other intellectual property mentioned or depicted on this site. Such intellectual property remains the property of its respective owners, and any references here are made solely for identification or informational purposes, without implying any affiliation, endorsement, or partnership.
We make no representations or warranties, express or implied, regarding the accuracy, completeness, or suitability of any content or products presented. Nothing on this website should be construed as legal, tax, investment, financial, medical, or other professional advice. In addition, no part of this site—including articles or product references—constitutes a solicitation, recommendation, endorsement, advertisement, or offer to buy or sell any securities, franchises, or other financial instruments, particularly in jurisdictions where such activity would be unlawful.
All content is of a general nature and may not address the specific circumstances of any individual or entity. It is not a substitute for professional advice or services. Any actions you take based on the information provided here are strictly at your own risk. You accept full responsibility for any decisions or outcomes arising from your use of this website and agree to release us from any liability in connection with your use of, or reliance upon, the content or products found herein.