
|
Tadano Ltd. (6395.T) DCF Valuation |
Fully Editable: Tailor To Your Needs In Excel Or Sheets
Professional Design: Trusted, Industry-Standard Templates
Investor-Approved Valuation Models
MAC/PC Compatible, Fully Unlocked
No Expertise Is Needed; Easy To Follow
Tadano Ltd. (6395.T) Bundle
Explore the financial prospects of Tadano Ltd. (6395T) with our user-friendly DCF Calculator! Enter your assumptions regarding growth, margins, and expenses to calculate the intrinsic value of Tadano Ltd. (6395T) and refine your investment approach.
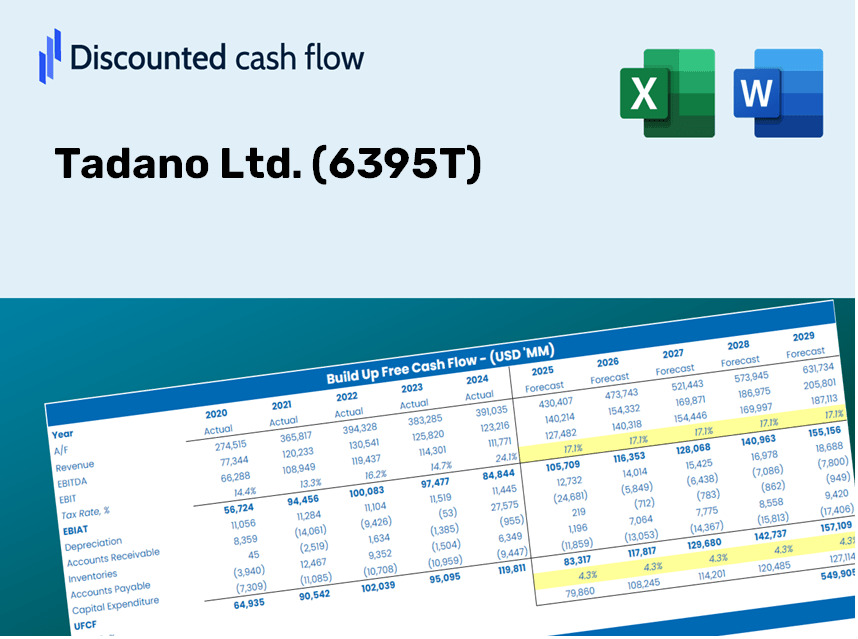
Discounted Cash Flow (DCF) - (USD MM)
| Year | AY1 2020 |
AY2 2021 |
AY3 2022 |
AY4 2023 |
AY5 2024 |
FY1 2025 |
FY2 2026 |
FY3 2027 |
FY4 2028 |
FY5 2029 |
|---|---|---|---|---|---|---|---|---|---|---|
| Revenue | 186,096.0 | 205,661.0 | 257,242.0 | 280,266.0 | 291,500.0 | 326,882.7 | 366,560.3 | 411,054.0 | 460,948.4 | 516,899.0 |
| Revenue Growth, % | 0 | 10.51 | 25.08 | 8.95 | 4.01 | 12.14 | 12.14 | 12.14 | 12.14 | 12.14 |
| EBITDA | 1,876.0 | 11,439.0 | 16,141.3 | 24,362.0 | 24,786.0 | 19,639.3 | 22,023.1 | 24,696.3 | 27,694.0 | 31,055.6 |
| EBITDA, % | 1.01 | 5.56 | 6.27 | 8.69 | 8.5 | 6.01 | 6.01 | 6.01 | 6.01 | 6.01 |
| Depreciation | 5,983.0 | 5,577.0 | 6,552.0 | 6,013.0 | 6,896.0 | 8,489.1 | 9,519.5 | 10,675.0 | 11,970.8 | 13,423.8 |
| Depreciation, % | 3.22 | 2.71 | 2.55 | 2.15 | 2.37 | 2.6 | 2.6 | 2.6 | 2.6 | 2.6 |
| EBIT | -4,107.0 | 5,862.0 | 9,589.3 | 18,349.0 | 17,890.0 | 11,150.2 | 12,503.6 | 14,021.3 | 15,723.3 | 17,631.8 |
| EBIT, % | -2.21 | 2.85 | 3.73 | 6.55 | 6.14 | 3.41 | 3.41 | 3.41 | 3.41 | 3.41 |
| Total Cash | 103,110.0 | 118,396.0 | 98,158.0 | 94,343.0 | 93,125.0 | 141,698.5 | 158,898.0 | 178,185.3 | 199,813.8 | 224,067.5 |
| Total Cash, percent | .0 | .0 | .0 | .0 | .0 | .0 | .0 | .0 | .0 | .0 |
| Account Receivables | 48,192.0 | 44,494.0 | 48,176.0 | 49,859.0 | 42,852.0 | 64,558.8 | 72,395.1 | 81,182.5 | 91,036.6 | 102,086.8 |
| Account Receivables, % | 25.9 | 21.63 | 18.73 | 17.79 | 14.7 | 19.75 | 19.75 | 19.75 | 19.75 | 19.75 |
| Inventories | 82,008.0 | 83,450.0 | 109,405.0 | 122,281.0 | 138,018.0 | 142,620.2 | 159,931.6 | 179,344.4 | 201,113.5 | 225,525.0 |
| Inventories, % | 44.07 | 40.58 | 42.53 | 43.63 | 47.35 | 43.63 | 43.63 | 43.63 | 43.63 | 43.63 |
| Accounts Payable | 27,666.0 | 33,126.0 | 48,894.0 | 48,437.0 | 34,551.0 | 51,723.3 | 58,001.5 | 65,041.9 | 72,936.7 | 81,789.9 |
| Accounts Payable, % | 14.87 | 16.11 | 19.01 | 17.28 | 11.85 | 15.82 | 15.82 | 15.82 | 15.82 | 15.82 |
| Capital Expenditure | -3,853.0 | -2,596.0 | -3,788.0 | -3,115.0 | -7,720.0 | -5,599.5 | -6,279.2 | -7,041.4 | -7,896.1 | -8,854.5 |
| Capital Expenditure, % | -2.07 | -1.26 | -1.47 | -1.11 | -2.65 | -1.71 | -1.71 | -1.71 | -1.71 | -1.71 |
| Tax Rate, % | 57.82 | 57.82 | 57.82 | 57.82 | 57.82 | 57.82 | 57.82 | 57.82 | 57.82 | 57.82 |
| EBITAT | -4,316.0 | 4,738.8 | 2,780.1 | 7,799.4 | 7,546.9 | 6,567.9 | 7,365.2 | 8,259.2 | 9,261.7 | 10,385.9 |
| Depreciation | ||||||||||
| Changes in Account Receivables | ||||||||||
| Changes in Inventories | ||||||||||
| Changes in Accounts Payable | ||||||||||
| Capital Expenditure | ||||||||||
| UFCF | -104,720.0 | 15,435.8 | -8,324.9 | -4,318.6 | -15,893.1 | 320.7 | -8,264.0 | -9,267.1 | -10,392.0 | -11,653.4 |
| WACC, % | 4.86 | 4.52 | 3.58 | 3.83 | 3.82 | 4.12 | 4.12 | 4.12 | 4.12 | 4.12 |
| PV UFCF | ||||||||||
| SUM PV UFCF | -33,889.6 | |||||||||
| Long Term Growth Rate, % | 3.30 | |||||||||
| Free cash flow (T + 1) | -12,038 | |||||||||
| Terminal Value | -1,467,010 | |||||||||
| Present Terminal Value | -1,198,810 | |||||||||
| Enterprise Value | -1,232,700 | |||||||||
| Net Debt | 29,347 | |||||||||
| Equity Value | -1,262,047 | |||||||||
| Diluted Shares Outstanding, MM | 127 | |||||||||
| Equity Value Per Share | -9,935.65 |
Benefits of Choosing Our Model for Tadano Ltd. (6395T)
- Adjustable Forecast Variables: Modify key assumptions (growth %, margins, WACC) effortlessly to explore various scenarios.
- Pre-Populated Market Data: Relevant financial data for Tadano Ltd. (6395T) included to streamline your analysis.
- Instant DCF Calculations: The template automatically computes Net Present Value (NPV) and intrinsic value for your convenience.
- Sleek and Customizable Design: A professional Excel model tailored to fit your valuation requirements.
- Tailored for Analysts and Investors: Perfect for evaluating projections, confirming strategies, and enhancing efficiency.
Key Features
- 🔍 Real-Life Tadano Financials: Pre-filled historical and projected data for Tadano Ltd. (6395T).
- ✏️ Fully Customizable Inputs: Modify all essential parameters (yellow cells) such as WACC, growth %, and tax rates.
- 📊 Professional DCF Valuation: Integrated formulas compute Tadano’s intrinsic value utilizing the Discounted Cash Flow method.
- ⚡ Instant Results: View Tadano’s valuation immediately after making any adjustments.
- Scenario Analysis: Evaluate and compare different outcomes based on various financial assumptions side-by-side.
How It Functions
- 1. Access the Template: Download and open the Excel file featuring Tadano Ltd.'s (6395T) preloaded data.
- 2. Adjust Assumptions: Modify key inputs such as growth rates, WACC, and capital investments.
- 3. View Results in Real-Time: The DCF model automatically computes intrinsic value and NPV.
- 4. Explore Different Scenarios: Evaluate multiple forecasts to investigate various valuation results.
- 5. Utilize with Assurance: Deliver professional valuation analyses to inform your strategies.
Why Choose This Calculator for Tadano Ltd. (6395T)?
- Designed for Experts: A sophisticated tool tailored for analysts, CFOs, and consultants.
- Accurate Financial Data: Tadano’s historical and projected financial figures are preloaded for precision.
- Versatile Scenario Analysis: Effortlessly model various forecasts and assumptions.
- Transparent Results: Automatically computes intrinsic value, NPV, and other essential metrics.
- User-Friendly: Step-by-step guidance leads you through the entire process.
Who Should Utilize This Product?
- Professional Investors: Develop comprehensive and accurate valuation models for analyzing portfolios involving Tadano Ltd. (6395T).
- Corporate Finance Teams: Assess valuation scenarios to inform strategic decisions within their organizations regarding Tadano Ltd. (6395T).
- Consultants and Advisors: Deliver precise valuation insights to clients interested in Tadano Ltd. (6395T).
- Students and Educators: Leverage real-world data to enhance learning and practice in financial modeling with a focus on Tadano Ltd. (6395T).
- Tech Enthusiasts: Gain insight into the valuation of technology companies like Tadano Ltd. (6395T) within the market.
What the Template Includes
- Historical Data: Provides insights into Tadano Ltd.’s (6395T) previous financial performance and baseline forecasts.
- DCF and Levered DCF Models: Comprehensive templates designed to assess the intrinsic value of Tadano Ltd. (6395T).
- WACC Sheet: Pre-configured calculations for the Weighted Average Cost of Capital.
- Editable Inputs: Adjust essential drivers such as growth rates, EBITDA margins, and CAPEX projections.
- Quarterly and Annual Statements: A thorough analysis of Tadano Ltd.’s (6395T) financial statements.
- Interactive Dashboard: Visual representations of valuation outcomes and forecasts in an engaging format.
Disclaimer
All information, articles, and product details provided on this website are for general informational and educational purposes only. We do not claim any ownership over, nor do we intend to infringe upon, any trademarks, copyrights, logos, brand names, or other intellectual property mentioned or depicted on this site. Such intellectual property remains the property of its respective owners, and any references here are made solely for identification or informational purposes, without implying any affiliation, endorsement, or partnership.
We make no representations or warranties, express or implied, regarding the accuracy, completeness, or suitability of any content or products presented. Nothing on this website should be construed as legal, tax, investment, financial, medical, or other professional advice. In addition, no part of this site—including articles or product references—constitutes a solicitation, recommendation, endorsement, advertisement, or offer to buy or sell any securities, franchises, or other financial instruments, particularly in jurisdictions where such activity would be unlawful.
All content is of a general nature and may not address the specific circumstances of any individual or entity. It is not a substitute for professional advice or services. Any actions you take based on the information provided here are strictly at your own risk. You accept full responsibility for any decisions or outcomes arising from your use of this website and agree to release us from any liability in connection with your use of, or reliance upon, the content or products found herein.