
|
Riso Kagaku Corporation (6413.T) DCF Valuation |
Fully Editable: Tailor To Your Needs In Excel Or Sheets
Professional Design: Trusted, Industry-Standard Templates
Investor-Approved Valuation Models
MAC/PC Compatible, Fully Unlocked
No Expertise Is Needed; Easy To Follow
Riso Kagaku Corporation (6413.T) Bundle
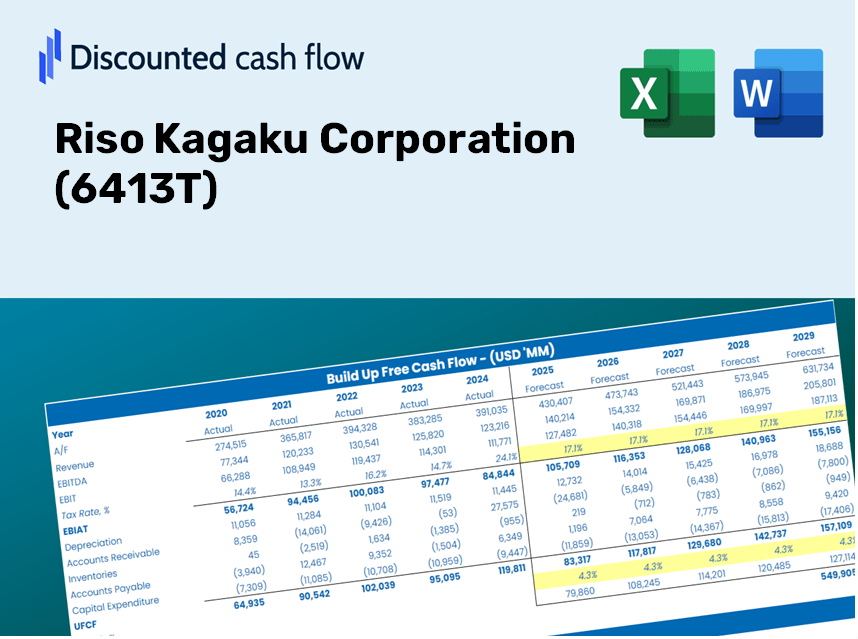
Gain insights into your Riso Kagaku Corporation (6413T) valuation analysis using our sophisticated DCF Calculator! This Excel template comes preloaded with real (6413T) data, enabling you to adjust forecasts and assumptions for an accurate calculation of Riso Kagaku Corporation's intrinsic value.
Discounted Cash Flow (DCF) - (USD MM)
| Year | AY1 2020 |
AY2 2021 |
AY3 2022 |
AY4 2023 |
AY5 2024 |
FY1 2025 |
FY2 2026 |
FY3 2027 |
FY4 2028 |
FY5 2029 |
|---|---|---|---|---|---|---|---|---|---|---|
| Revenue | 68,434.0 | 69,313.0 | 74,655.0 | 74,602.0 | 78,723.0 | 81,565.8 | 84,511.2 | 87,563.0 | 90,725.0 | 94,001.2 |
| Revenue Growth, % | 0 | 1.28 | 7.71 | -0.07099324 | 5.52 | 3.61 | 3.61 | 3.61 | 3.61 | 3.61 |
| EBITDA | 5,188.0 | 8,144.0 | 9,198.0 | 9,417.0 | 9,277.0 | 9,144.9 | 9,475.2 | 9,817.3 | 10,171.8 | 10,539.2 |
| EBITDA, % | 7.58 | 11.75 | 12.32 | 12.62 | 11.78 | 11.21 | 11.21 | 11.21 | 11.21 | 11.21 |
| Depreciation | 3,792.0 | 3,390.0 | 2,819.0 | 2,714.0 | 3,503.0 | 3,637.1 | 3,768.5 | 3,904.6 | 4,045.6 | 4,191.7 |
| Depreciation, % | 5.54 | 4.89 | 3.78 | 3.64 | 4.45 | 4.46 | 4.46 | 4.46 | 4.46 | 4.46 |
| EBIT | 1,396.0 | 4,754.0 | 6,379.0 | 6,703.0 | 5,774.0 | 5,507.8 | 5,706.7 | 5,912.8 | 6,126.3 | 6,347.5 |
| EBIT, % | 2.04 | 6.86 | 8.54 | 8.99 | 7.33 | 6.75 | 6.75 | 6.75 | 6.75 | 6.75 |
| Total Cash | 18,523.0 | 19,753.0 | 20,661.0 | 21,488.0 | 13,828.0 | 21,143.4 | 21,906.9 | 22,698.0 | 23,517.6 | 24,366.9 |
| Total Cash, percent | .0 | .0 | .0 | .0 | .0 | .0 | .0 | .0 | .0 | .0 |
| Account Receivables | 13,184.0 | 12,240.0 | 13,311.0 | 13,790.0 | 13,430.0 | 14,730.6 | 15,262.5 | 15,813.7 | 16,384.7 | 16,976.4 |
| Account Receivables, % | 19.27 | 17.66 | 17.83 | 18.48 | 17.06 | 18.06 | 18.06 | 18.06 | 18.06 | 18.06 |
| Inventories | 10,716.0 | 11,534.0 | 11,874.0 | 11,161.0 | 10,982.0 | 12,580.0 | 13,034.2 | 13,504.9 | 13,992.6 | 14,497.9 |
| Inventories, % | 15.66 | 16.64 | 15.91 | 14.96 | 13.95 | 15.42 | 15.42 | 15.42 | 15.42 | 15.42 |
| Accounts Payable | 9,522.0 | 8,454.0 | 9,189.0 | 9,254.0 | 5,556.0 | 9,442.3 | 9,783.3 | 10,136.6 | 10,502.6 | 10,881.9 |
| Accounts Payable, % | 13.91 | 12.2 | 12.31 | 12.4 | 7.06 | 11.58 | 11.58 | 11.58 | 11.58 | 11.58 |
| Capital Expenditure | -2,239.0 | -1,247.0 | -902.0 | -933.0 | -1,753.0 | -1,591.6 | -1,649.1 | -1,708.6 | -1,770.3 | -1,834.2 |
| Capital Expenditure, % | -3.27 | -1.8 | -1.21 | -1.25 | -2.23 | -1.95 | -1.95 | -1.95 | -1.95 | -1.95 |
| Tax Rate, % | 28.57 | 28.57 | 28.57 | 28.57 | 28.57 | 28.57 | 28.57 | 28.57 | 28.57 | 28.57 |
| EBITAT | 1,406.2 | 3,605.3 | 4,641.5 | 4,836.8 | 4,124.4 | 4,320.2 | 4,476.2 | 4,637.8 | 4,805.3 | 4,978.8 |
| Depreciation | ||||||||||
| Changes in Account Receivables | ||||||||||
| Changes in Inventories | ||||||||||
| Changes in Accounts Payable | ||||||||||
| Capital Expenditure | ||||||||||
| UFCF | -11,418.8 | 4,806.3 | 5,882.5 | 6,916.8 | 2,715.4 | 7,353.5 | 5,950.4 | 6,165.2 | 6,387.9 | 6,618.5 |
| WACC, % | 5.12 | 5.08 | 5.07 | 5.07 | 5.07 | 5.08 | 5.08 | 5.08 | 5.08 | 5.08 |
| PV UFCF | ||||||||||
| SUM PV UFCF | 28,104.6 | |||||||||
| Long Term Growth Rate, % | 1.00 | |||||||||
| Free cash flow (T + 1) | 6,685 | |||||||||
| Terminal Value | 163,767 | |||||||||
| Present Terminal Value | 127,817 | |||||||||
| Enterprise Value | 155,921 | |||||||||
| Net Debt | -9,198 | |||||||||
| Equity Value | 165,119 | |||||||||
| Diluted Shares Outstanding, MM | 65 | |||||||||
| Equity Value Per Share | 2,536.55 |
What You Will Receive
- Accurate Riso Kagaku Financial Data: Pre-loaded with historical and projected figures specific to Riso Kagaku for detailed analysis.
- Completely Customizable Template: Easily adjust key parameters such as revenue growth, WACC, and EBITDA percentage.
- Instant Calculations: Watch Riso Kagaku's intrinsic value refresh immediately based on your input modifications.
- Expert Valuation Tool: Tailored for investors, analysts, and consultants aiming for precise DCF results.
- Intuitive Design: Streamlined layout and straightforward instructions suited for users of all skill levels.
Key Features
- 🔍 Real-Life Riso Kagaku Financials: Pre-loaded historical and projected data for Riso Kagaku Corporation (6413T).
- ✏️ Fully Customizable Inputs: Modify all essential parameters (yellow cells) such as WACC, growth %, and tax rates.
- 📊 Professional DCF Valuation: Integrated formulas calculate Riso Kagaku’s intrinsic value using the Discounted Cash Flow approach.
- ⚡ Instant Results: Visualize Riso Kagaku’s valuation immediately after making adjustments.
- Scenario Analysis: Evaluate and compare outcomes for diverse financial assumptions side-by-side.
How It Works
- Download: Get the pre-built Excel file containing Riso Kagaku Corporation's (6413T) financial data.
- Customize: Modify forecasts such as revenue growth, EBITDA %, and WACC to fit your analysis.
- Update Automatically: The intrinsic value and NPV calculations refresh in real-time.
- Test Scenarios: Generate various projections and instantly compare the results.
- Make Decisions: Utilize the valuation outputs to inform your investment strategy for Riso Kagaku Corporation (6413T).
Why Choose This Calculator for Riso Kagaku Corporation (6413T)?
- All-in-One Solution: Combines DCF, WACC, and financial ratio assessments in a single tool.
- Flexible Inputs: Modify the highlighted fields to explore different scenarios.
- In-Depth Analysis: Automatically computes Riso Kagaku's intrinsic value and Net Present Value.
- Prepopulated Information: Historical and projected data provide reliable baseline metrics.
- High-Quality Standards: Perfect for financial analysts, investors, and business consultants.
Who Can Benefit from This Product?
- Finance Students: Discover valuation strategies and practice with actual data.
- Researchers: Integrate industry-standard models into your academic studies or projects.
- Investors: Validate your hypotheses and explore valuation scenarios for Riso Kagaku Corporation (6413T).
- Financial Analysts: Enhance your efficiency with a ready-to-use, customizable DCF model.
- Small Business Owners: Understand the analytical approaches used for large public entities like Riso Kagaku Corporation (6413T).
Contents of the Template
- Comprehensive DCF Model: Fully editable template featuring intricate valuation calculations.
- Real-World Data: Preloaded historical and projected financials for Riso Kagaku Corporation (6413T) to facilitate analysis.
- Customizable Parameters: Modify WACC, growth rates, and tax assumptions to explore various scenarios.
- Financial Statements: Detailed annual and quarterly reports for enhanced insights.
- Key Ratios: Integrated analysis covering profitability, efficiency, and leverage metrics.
- Dashboard with Visual Outputs: Clear charts and tables providing actionable results.
Disclaimer
All information, articles, and product details provided on this website are for general informational and educational purposes only. We do not claim any ownership over, nor do we intend to infringe upon, any trademarks, copyrights, logos, brand names, or other intellectual property mentioned or depicted on this site. Such intellectual property remains the property of its respective owners, and any references here are made solely for identification or informational purposes, without implying any affiliation, endorsement, or partnership.
We make no representations or warranties, express or implied, regarding the accuracy, completeness, or suitability of any content or products presented. Nothing on this website should be construed as legal, tax, investment, financial, medical, or other professional advice. In addition, no part of this site—including articles or product references—constitutes a solicitation, recommendation, endorsement, advertisement, or offer to buy or sell any securities, franchises, or other financial instruments, particularly in jurisdictions where such activity would be unlawful.
All content is of a general nature and may not address the specific circumstances of any individual or entity. It is not a substitute for professional advice or services. Any actions you take based on the information provided here are strictly at your own risk. You accept full responsibility for any decisions or outcomes arising from your use of this website and agree to release us from any liability in connection with your use of, or reliance upon, the content or products found herein.