
|
Brother Industries, Ltd. (6448.T) DCF Valuation |
Fully Editable: Tailor To Your Needs In Excel Or Sheets
Professional Design: Trusted, Industry-Standard Templates
Investor-Approved Valuation Models
MAC/PC Compatible, Fully Unlocked
No Expertise Is Needed; Easy To Follow
Brother Industries, Ltd. (6448.T) Bundle
Whether you’re an investor or analyst, this (6448T) DCF Calculator is your ultimate tool for accurate valuation. Preloaded with Brother Industries, Ltd. real data, you can adjust forecasts and observe the effects in real-time.
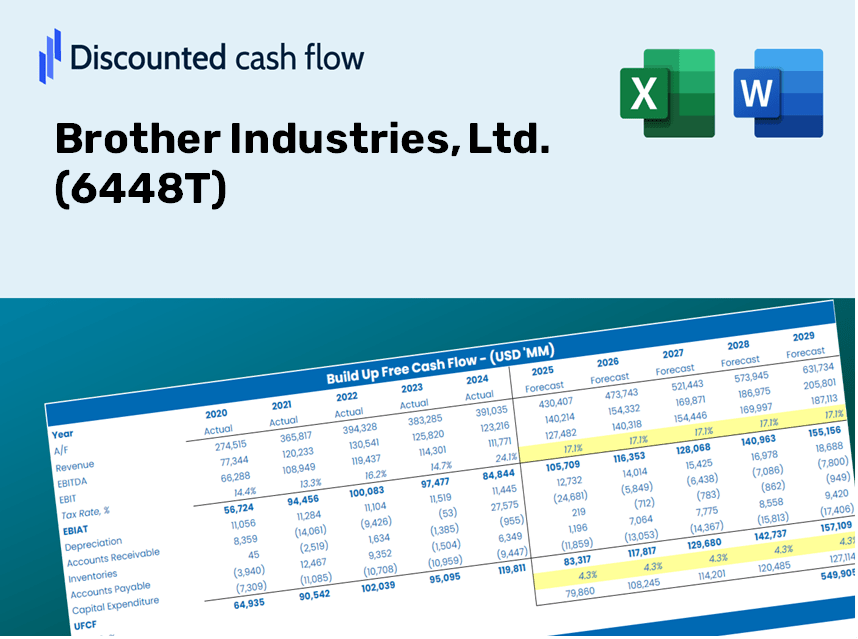
Discounted Cash Flow (DCF) - (USD MM)
| Year | AY1 2021 |
AY2 2022 |
AY3 2023 |
AY4 2024 |
AY5 2025 |
FY1 2026 |
FY2 2027 |
FY3 2028 |
FY4 2029 |
FY5 2030 |
|---|---|---|---|---|---|---|---|---|---|---|
| Revenue | 631,812.0 | 710,938.0 | 815,269.0 | 822,930.0 | 876,558.0 | 952,501.2 | 1,035,024.0 | 1,124,696.3 | 1,222,137.7 | 1,328,021.3 |
| Revenue Growth, % | 0 | 12.52 | 14.68 | 0.93969 | 6.52 | 8.66 | 8.66 | 8.66 | 8.66 | 8.66 |
| EBITDA | 82,614.0 | 125,723.0 | 100,807.0 | 103,501.0 | 122,575.0 | 132,751.1 | 144,252.3 | 156,750.1 | 170,330.6 | 185,087.7 |
| EBITDA, % | 13.08 | 17.68 | 12.36 | 12.58 | 13.98 | 13.94 | 13.94 | 13.94 | 13.94 | 13.94 |
| Depreciation | 38,252.0 | 38,700.0 | 42,575.0 | 47,537.0 | 52,686.0 | 54,306.2 | 59,011.2 | 64,123.8 | 69,679.3 | 75,716.2 |
| Depreciation, % | 6.05 | 5.44 | 5.22 | 5.78 | 6.01 | 5.7 | 5.7 | 5.7 | 5.7 | 5.7 |
| EBIT | 44,362.0 | 87,023.0 | 58,232.0 | 55,964.0 | 69,889.0 | 78,444.9 | 85,241.2 | 92,626.3 | 100,651.2 | 109,371.5 |
| EBIT, % | 7.02 | 12.24 | 7.14 | 6.8 | 7.97 | 8.24 | 8.24 | 8.24 | 8.24 | 8.24 |
| Total Cash | 199,393.0 | 179,334.0 | 129,909.0 | 173,563.0 | 172,776.0 | 216,255.8 | 234,991.8 | 255,351.0 | 277,474.1 | 301,513.9 |
| Total Cash, percent | .0 | .0 | .0 | .0 | .0 | .0 | .0 | .0 | .0 | .0 |
| Account Receivables | 93,055.0 | 102,685.0 | 123,260.0 | 131,591.0 | 134,719.0 | 144,114.3 | 156,600.0 | 170,167.5 | 184,910.5 | 200,930.8 |
| Account Receivables, % | 14.73 | 14.44 | 15.12 | 15.99 | 15.37 | 15.13 | 15.13 | 15.13 | 15.13 | 15.13 |
| Inventories | 120,186.0 | 169,583.0 | 222,133.0 | 207,971.0 | 226,840.0 | 231,025.3 | 251,040.8 | 272,790.5 | 296,424.5 | 322,106.1 |
| Inventories, % | 19.02 | 23.85 | 27.25 | 25.27 | 25.88 | 24.25 | 24.25 | 24.25 | 24.25 | 24.25 |
| Accounts Payable | 34,010.0 | 49,253.0 | 57,806.0 | 74,289.0 | 88,449.0 | 73,379.0 | 79,736.4 | 86,644.6 | 94,151.3 | 102,308.4 |
| Accounts Payable, % | 5.38 | 6.93 | 7.09 | 9.03 | 10.09 | 7.7 | 7.7 | 7.7 | 7.7 | 7.7 |
| Capital Expenditure | -27,514.0 | -35,842.0 | -42,482.0 | -47,485.0 | -35,783.0 | -46,595.5 | -50,632.4 | -55,019.1 | -59,785.8 | -64,965.6 |
| Capital Expenditure, % | -4.35 | -5.04 | -5.21 | -5.77 | -4.08 | -4.89 | -4.89 | -4.89 | -4.89 | -4.89 |
| Tax Rate, % | 26.66 | 26.66 | 26.66 | 26.66 | 26.66 | 26.66 | 26.66 | 26.66 | 26.66 | 26.66 |
| EBITAT | 25,329.6 | 61,449.4 | 39,959.7 | 33,718.2 | 51,254.2 | 51,760.8 | 56,245.2 | 61,118.2 | 66,413.4 | 72,167.3 |
| Depreciation | ||||||||||
| Changes in Account Receivables | ||||||||||
| Changes in Inventories | ||||||||||
| Changes in Accounts Payable | ||||||||||
| Capital Expenditure | ||||||||||
| UFCF | -143,163.4 | 20,523.4 | -24,519.3 | 56,084.2 | 60,320.2 | 30,821.0 | 38,480.1 | 41,813.9 | 45,436.6 | 49,373.1 |
| WACC, % | 5.43 | 5.46 | 5.46 | 5.44 | 5.47 | 5.45 | 5.45 | 5.45 | 5.45 | 5.45 |
| PV UFCF | ||||||||||
| SUM PV UFCF | 174,111.3 | |||||||||
| Long Term Growth Rate, % | 2.00 | |||||||||
| Free cash flow (T + 1) | 50,361 | |||||||||
| Terminal Value | 1,460,085 | |||||||||
| Present Terminal Value | 1,119,857 | |||||||||
| Enterprise Value | 1,293,968 | |||||||||
| Net Debt | -172,176 | |||||||||
| Equity Value | 1,466,144 | |||||||||
| Diluted Shares Outstanding, MM | 256 | |||||||||
| Equity Value Per Share | 5,720.80 |
What You Will Receive
- Authentic Brother Industries Financials: Features historical and projected data for precise valuation.
- Customizable Inputs: Adjust WACC, tax rates, revenue growth, and capital expenditures as needed.
- Real-Time Calculations: Intrinsic value and NPV are computed in real-time for your convenience.
- Scenario Evaluation: Analyze various scenarios to assess Brother Industries’ future trajectory.
- User-Friendly Interface: Designed for professionals while remaining approachable for newcomers.
Key Features
- Advanced DCF Calculator: Features comprehensive unlevered and levered DCF valuation models tailored for Brother Industries, Ltd. (6448T).
- WACC Calculator: Includes a pre-configured Weighted Average Cost of Capital sheet with flexible input options.
- Customizable Forecast Assumptions: Adjust growth rates, capital expenditures, and discount rates according to your analysis needs.
- Integrated Financial Ratios: Evaluate profitability, leverage, and efficiency ratios specific to Brother Industries, Ltd. (6448T).
- Dashboard and Visualizations: Graphical summaries present key valuation metrics for straightforward assessment.
How It Operates
- Step 1: Download the Excel spreadsheet.
- Step 2: Examine the pre-filled Brother Industries data (historical and forecasted).
- Step 3: Modify key assumptions (highlighted in yellow) based on your insights.
- Step 4: Observe automatic updates for Brother Industries' intrinsic value.
- Step 5: Utilize the results for your investment strategies or reporting purposes.
Why Opt for This Calculator?
- Reliable Data: Accurate financials from Brother Industries, Ltd. ([6448T]) guarantee trustworthy valuation outcomes.
- Flexible: Modify essential parameters such as growth rates, WACC, and tax rates to align with your forecasts.
- Efficient: Built-in calculations save you the effort of starting from the ground up.
- Professional-Quality Tool: Tailored for investors, analysts, and consultants.
- Easy to Use: User-friendly design and clear, step-by-step guidance ensure accessibility for all users.
Who Can Benefit from This Product?
- Investors: Effectively gauge Brother Industries, Ltd.'s (6448T) fair value before making investment choices.
- CFOs: Utilize a high-quality DCF model for precise financial reporting and analysis.
- Consultants: Easily customize the template for client valuation reports.
- Entrepreneurs: Discover valuable insights into financial modeling practices of leading corporations.
- Educators: Employ this tool to illustrate valuation techniques in the classroom.
Contents of the Template
- In-Depth DCF Model: A customizable template featuring extensive valuation calculations.
- Real-World Financial Data: Brother Industries, Ltd. (6448T) historical and projected financials included for thorough analysis.
- Adjustable Parameters: Modify WACC, growth rates, and tax assumptions to explore various scenarios.
- Comprehensive Financial Statements: Complete annual and quarterly breakdowns for enhanced analysis.
- Essential Ratios: Integrated assessments for profitability, efficiency, and leverage metrics.
- Visual Dashboard: Graphs and tables designed for clear, actionable insights.
Disclaimer
All information, articles, and product details provided on this website are for general informational and educational purposes only. We do not claim any ownership over, nor do we intend to infringe upon, any trademarks, copyrights, logos, brand names, or other intellectual property mentioned or depicted on this site. Such intellectual property remains the property of its respective owners, and any references here are made solely for identification or informational purposes, without implying any affiliation, endorsement, or partnership.
We make no representations or warranties, express or implied, regarding the accuracy, completeness, or suitability of any content or products presented. Nothing on this website should be construed as legal, tax, investment, financial, medical, or other professional advice. In addition, no part of this site—including articles or product references—constitutes a solicitation, recommendation, endorsement, advertisement, or offer to buy or sell any securities, franchises, or other financial instruments, particularly in jurisdictions where such activity would be unlawful.
All content is of a general nature and may not address the specific circumstances of any individual or entity. It is not a substitute for professional advice or services. Any actions you take based on the information provided here are strictly at your own risk. You accept full responsibility for any decisions or outcomes arising from your use of this website and agree to release us from any liability in connection with your use of, or reliance upon, the content or products found herein.