
|
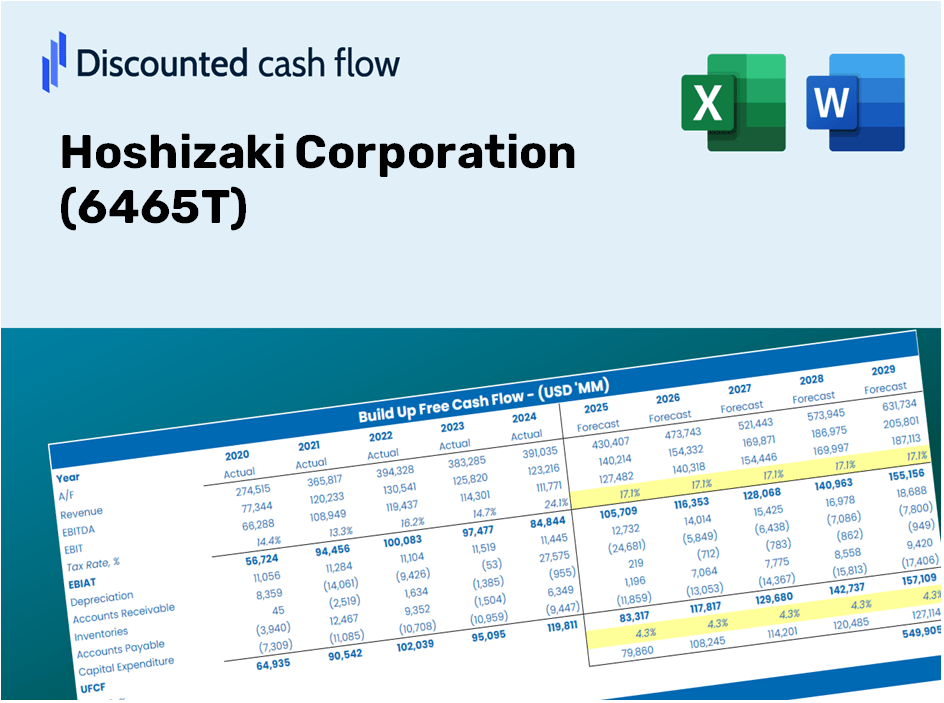
Hoshizaki Corporation (6465.T) DCF Valuation |
Fully Editable: Tailor To Your Needs In Excel Or Sheets
Professional Design: Trusted, Industry-Standard Templates
Investor-Approved Valuation Models
MAC/PC Compatible, Fully Unlocked
No Expertise Is Needed; Easy To Follow
Hoshizaki Corporation (6465.T) Bundle
Explore Hoshizaki Corporation's (6465T) financial future with our user-friendly DCF Calculator! Enter your projections for growth, profit margins, and expenses to calculate Hoshizaki Corporation's (6465T) intrinsic value and refine your investment strategy.
Discounted Cash Flow (DCF) - (USD MM)
| Year | AY1 2020 |
AY2 2021 |
AY3 2022 |
AY4 2023 |
AY5 2024 |
FY1 2025 |
FY2 2026 |
FY3 2027 |
FY4 2028 |
FY5 2029 |
|---|---|---|---|---|---|---|---|---|---|---|
| Revenue | 238,314.0 | 274,419.0 | 321,338.0 | 373,563.0 | 445,495.0 | 520,957.1 | 609,201.8 | 712,394.1 | 833,066.1 | 974,178.7 |
| Revenue Growth, % | 0 | 15.15 | 17.1 | 16.25 | 19.26 | 16.94 | 16.94 | 16.94 | 16.94 | 16.94 |
| EBITDA | 22,792.0 | 36,503.0 | 40,765.0 | 56,009.0 | 62,617.0 | 67,308.3 | 78,709.6 | 92,042.1 | 107,633.1 | 125,865.0 |
| EBITDA, % | 9.56 | 13.3 | 12.69 | 14.99 | 14.06 | 12.92 | 12.92 | 12.92 | 12.92 | 12.92 |
| Depreciation | 5,470.0 | 5,230.0 | 6,628.0 | 7,550.0 | 11,137.0 | 11,236.8 | 13,140.2 | 15,366.0 | 17,968.8 | 21,012.6 |
| Depreciation, % | 2.3 | 1.91 | 2.06 | 2.02 | 2.5 | 2.16 | 2.16 | 2.16 | 2.16 | 2.16 |
| EBIT | 17,322.0 | 31,273.0 | 34,137.0 | 48,459.0 | 51,480.0 | 56,071.5 | 65,569.4 | 76,676.2 | 89,664.3 | 104,852.5 |
| EBIT, % | 7.27 | 11.4 | 10.62 | 12.97 | 11.56 | 10.76 | 10.76 | 10.76 | 10.76 | 10.76 |
| Total Cash | 217,212.0 | 240,723.0 | 226,065.0 | 254,530.0 | 239,035.0 | 386,559.8 | 452,039.0 | 528,609.6 | 618,150.4 | 722,858.6 |
| Total Cash, percent | .0 | .0 | .0 | .0 | .0 | .0 | .0 | .0 | .0 | .0 |
| Account Receivables | 27,122.0 | 31,120.0 | 45,783.0 | 52,026.0 | 70,253.0 | 69,459.6 | 81,225.3 | 94,984.0 | 111,073.3 | 129,887.9 |
| Account Receivables, % | 11.38 | 11.34 | 14.25 | 13.93 | 15.77 | 13.33 | 13.33 | 13.33 | 13.33 | 13.33 |
| Inventories | 28,405.0 | 35,555.0 | 51,825.0 | 52,263.0 | 69,164.0 | 73,474.9 | 85,920.7 | 100,474.8 | 117,494.2 | 137,396.4 |
| Inventories, % | 11.92 | 12.96 | 16.13 | 13.99 | 15.53 | 14.1 | 14.1 | 14.1 | 14.1 | 14.1 |
| Accounts Payable | 16,052.0 | 26,070.0 | 32,714.0 | 30,308.0 | 36,252.0 | 44,455.3 | 51,985.6 | 60,791.4 | 71,088.8 | 83,130.5 |
| Accounts Payable, % | 6.74 | 9.5 | 10.18 | 8.11 | 8.14 | 8.53 | 8.53 | 8.53 | 8.53 | 8.53 |
| Capital Expenditure | -3,411.0 | -3,431.0 | -5,600.0 | -7,048.0 | -9,531.0 | -8,804.6 | -10,296.0 | -12,040.0 | -14,079.5 | -16,464.4 |
| Capital Expenditure, % | -1.43 | -1.25 | -1.74 | -1.89 | -2.14 | -1.69 | -1.69 | -1.69 | -1.69 | -1.69 |
| Tax Rate, % | 32.77 | 32.77 | 32.77 | 32.77 | 32.77 | 32.77 | 32.77 | 32.77 | 32.77 | 32.77 |
| EBITAT | 11,464.5 | 21,708.2 | 24,006.5 | 32,890.0 | 34,608.0 | 38,243.2 | 44,721.2 | 52,296.5 | 61,154.9 | 71,513.9 |
| Depreciation | ||||||||||
| Changes in Account Receivables | ||||||||||
| Changes in Inventories | ||||||||||
| Changes in Accounts Payable | ||||||||||
| Capital Expenditure | ||||||||||
| UFCF | -25,951.5 | 22,377.2 | 745.5 | 24,305.0 | 7,030.0 | 45,361.3 | 30,884.0 | 36,115.4 | 42,233.0 | 49,386.8 |
| WACC, % | 5.63 | 5.63 | 5.63 | 5.63 | 5.63 | 5.63 | 5.63 | 5.63 | 5.63 | 5.63 |
| PV UFCF | ||||||||||
| SUM PV UFCF | 172,732.2 | |||||||||
| Long Term Growth Rate, % | 2.00 | |||||||||
| Free cash flow (T + 1) | 50,375 | |||||||||
| Terminal Value | 1,386,690 | |||||||||
| Present Terminal Value | 1,054,356 | |||||||||
| Enterprise Value | 1,227,088 | |||||||||
| Net Debt | -239,035 | |||||||||
| Equity Value | 1,466,123 | |||||||||
| Diluted Shares Outstanding, MM | 144 | |||||||||
| Equity Value Per Share | 10,195.57 |
What You Will Receive
- Pre-Populated Financial Model: Hoshizaki Corporation’s actual data supports accurate DCF valuation.
- Comprehensive Forecast Control: Modify revenue growth, profit margins, WACC, and other essential factors.
- Real-Time Calculations: Automatic updates provide immediate results as you make adjustments.
- Professional-Grade Template: A polished Excel file crafted for high-quality valuation purposes.
- Flexible and Reusable: Designed for adaptability, enabling ongoing use for in-depth forecasts.
Key Features
- Accurate Financial Data for Hoshizaki Corporation: Gain access to reliable pre-loaded historical figures and forecasts.
- Adjustable Forecast Inputs: Modify the highlighted cells, including WACC, growth percentages, and profit margins.
- Real-Time Calculations: Automatic updates to DCF, Net Present Value (NPV), and cash flow metrics.
- Interactive Dashboard: User-friendly charts and summaries for clear visualization of your valuation findings.
- Designed for All Skill Levels: An intuitive layout tailored for investors, CFOs, and consultants alike.
How It Operates
- Download: Get the ready-to-use Excel file featuring Hoshizaki Corporation's (6465T) financial data.
- Customize: Tailor forecasts, including revenue growth, EBITDA %, and WACC.
- Update Automatically: The intrinsic value and NPV calculations refresh in real-time.
- Test Scenarios: Generate multiple projections and compare the results instantly.
- Make Decisions: Leverage the valuation outcomes to shape your investment strategy.
Why Opt for Hoshizaki Corporation's Calculator?
- Time Efficient: Skip the hassle of building a DCF model from the ground up – it’s ready for immediate use.
- Enhanced Accuracy: Dependable financial data and formulas minimize valuation errors.
- Completely Customizable: Adjust the model to align with your specific assumptions and forecasts.
- Simple to Analyze: Intuitive charts and outputs facilitate easy interpretation of results.
- Endorsed by Professionals: Crafted for industry experts who prioritize precision and user-friendliness.
Who Is This Product Ideal For?
- Investors: Enhance your decision-making with a reliable, professional-level valuation tool.
- Financial Analysts: Streamline your workflow with a pre-configured DCF model that's easy to modify.
- Consultants: Effortlessly tailor the template for client reports and presentations.
- Finance Enthusiasts: Expand your knowledge of valuation methods through practical, real-world scenarios.
- Educators and Students: Utilize it as a hands-on resource for finance courses and learning experiences.
Contents of the Template
- Pre-Filled DCF Model: Hoshizaki Corporation’s financial data preloaded for immediate analysis.
- WACC Calculator: Comprehensive calculations for the Weighted Average Cost of Capital.
- Financial Ratios: Assess Hoshizaki’s profitability, leverage, and operational efficiency.
- Editable Inputs: Modify assumptions such as growth rates, margins, and capital expenditures to align with your scenarios.
- Financial Statements: Access annual and quarterly reports for thorough analysis support.
- Interactive Dashboard: Effortlessly visualize essential valuation metrics and outcomes.
Disclaimer
All information, articles, and product details provided on this website are for general informational and educational purposes only. We do not claim any ownership over, nor do we intend to infringe upon, any trademarks, copyrights, logos, brand names, or other intellectual property mentioned or depicted on this site. Such intellectual property remains the property of its respective owners, and any references here are made solely for identification or informational purposes, without implying any affiliation, endorsement, or partnership.
We make no representations or warranties, express or implied, regarding the accuracy, completeness, or suitability of any content or products presented. Nothing on this website should be construed as legal, tax, investment, financial, medical, or other professional advice. In addition, no part of this site—including articles or product references—constitutes a solicitation, recommendation, endorsement, advertisement, or offer to buy or sell any securities, franchises, or other financial instruments, particularly in jurisdictions where such activity would be unlawful.
All content is of a general nature and may not address the specific circumstances of any individual or entity. It is not a substitute for professional advice or services. Any actions you take based on the information provided here are strictly at your own risk. You accept full responsibility for any decisions or outcomes arising from your use of this website and agree to release us from any liability in connection with your use of, or reliance upon, the content or products found herein.