
|
Evergrande Property Services Group Limited (6666.HK) DCF Valuation |
Fully Editable: Tailor To Your Needs In Excel Or Sheets
Professional Design: Trusted, Industry-Standard Templates
Investor-Approved Valuation Models
MAC/PC Compatible, Fully Unlocked
No Expertise Is Needed; Easy To Follow
Evergrande Property Services Group Limited (6666.HK) Bundle
Explore the financial potential of Evergrande Property Services Group Limited (6666HK) with our user-friendly DCF Calculator! Enter your projections for growth, margins, and expenses to determine the intrinsic value of Evergrande Property Services Group Limited (6666HK) and enhance your investment approach.
Discounted Cash Flow (DCF) - (USD MM)
| Year | AY1 2020 |
AY2 2021 |
AY3 2022 |
AY4 2023 |
AY5 2024 |
FY1 2025 |
FY2 2026 |
FY3 2027 |
FY4 2028 |
FY5 2029 |
|---|---|---|---|---|---|---|---|---|---|---|
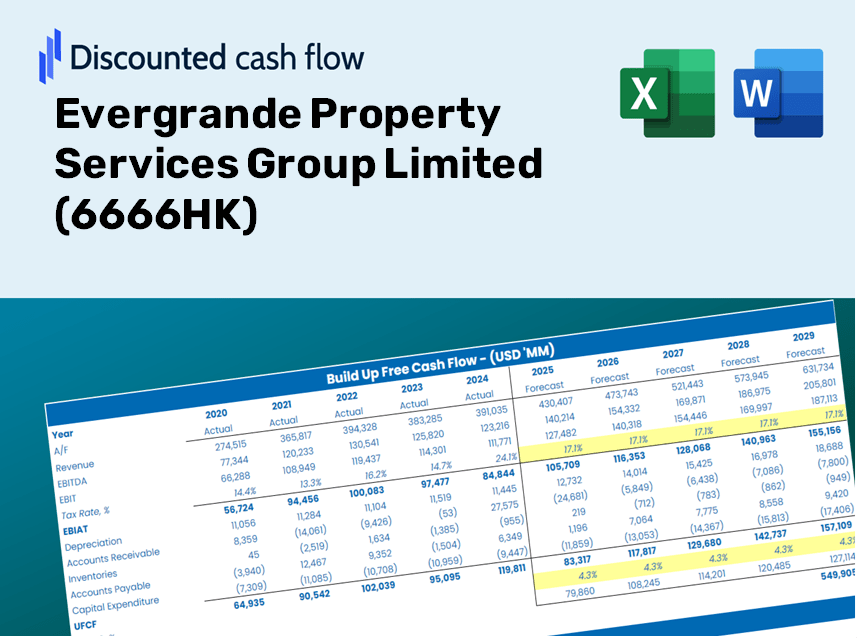
| Revenue | 11,793.5 | 14,431.7 | 12,917.5 | 13,658.4 | 13,953.9 | 15,995.4 | 18,335.6 | 21,018.1 | 24,093.1 | 27,617.9 |
| Revenue Growth, % | 0 | 22.37 | -10.49 | 5.74 | 2.16 | 14.63 | 14.63 | 14.63 | 14.63 | 14.63 |
| EBITDA | 3,875.5 | 235.7 | 2,541.2 | 2,563.4 | 1,872.0 | 2,762.4 | 3,166.6 | 3,629.9 | 4,160.9 | 4,769.7 |
| EBITDA, % | 32.86 | 1.63 | 19.67 | 18.77 | 13.42 | 17.27 | 17.27 | 17.27 | 17.27 | 17.27 |
| Depreciation | 47.0 | 422.4 | 388.4 | 243.3 | 236.4 | 313.8 | 359.7 | 412.3 | 472.6 | 541.7 |
| Depreciation, % | 0.39876 | 2.93 | 3.01 | 1.78 | 1.69 | 1.96 | 1.96 | 1.96 | 1.96 | 1.96 |
| EBIT | 3,828.4 | -186.7 | 2,152.8 | 2,320.1 | 1,635.6 | 2,448.7 | 2,806.9 | 3,217.6 | 3,688.3 | 4,227.9 |
| EBIT, % | 32.46 | -1.29 | 16.67 | 16.99 | 11.72 | 15.31 | 15.31 | 15.31 | 15.31 | 15.31 |
| Total Cash | 13,786.8 | 1,421.8 | 1,886.0 | 2,517.5 | 3,656.3 | 5,409.2 | 6,200.6 | 7,107.8 | 8,147.7 | 9,339.7 |
| Total Cash, percent | .0 | .0 | .0 | .0 | .0 | .0 | .0 | .0 | .0 | .0 |
| Account Receivables | 4,186.8 | 2,187.4 | 2,996.1 | 3,332.5 | 3,417.2 | 3,926.5 | 4,501.0 | 5,159.5 | 5,914.4 | 6,779.6 |
| Account Receivables, % | 35.5 | 15.16 | 23.19 | 24.4 | 24.49 | 24.55 | 24.55 | 24.55 | 24.55 | 24.55 |
| Inventories | -2,176.2 | -6.0 | -3.5 | 2.6 | 5.1 | -590.7 | -677.2 | -776.2 | -889.8 | -1,020.0 |
| Inventories, % | -18.45 | -0.04160393 | -0.02692821 | 0.01894039 | 0.03624766 | -3.69 | -3.69 | -3.69 | -3.69 | -3.69 |
| Accounts Payable | 128.5 | 3,961.0 | 292.4 | 1,548.2 | 1,932.5 | 1,791.0 | 2,053.0 | 2,353.3 | 2,697.6 | 3,092.3 |
| Accounts Payable, % | 1.09 | 27.45 | 2.26 | 11.34 | 13.85 | 11.2 | 11.2 | 11.2 | 11.2 | 11.2 |
| Capital Expenditure | -32.3 | -22.1 | -37.4 | -39.9 | -42.6 | -42.0 | -48.2 | -55.2 | -63.3 | -72.6 |
| Capital Expenditure, % | -0.27387 | -0.15303 | -0.28957 | -0.29231 | -0.30517 | -0.26279 | -0.26279 | -0.26279 | -0.26279 | -0.26279 |
| Tax Rate, % | 27.45 | 27.45 | 27.45 | 27.45 | 27.45 | 27.45 | 27.45 | 27.45 | 27.45 | 27.45 |
| EBITAT | 2,896.6 | -269.7 | 1,581.2 | 1,698.3 | 1,186.6 | 1,933.7 | 2,216.6 | 2,540.9 | 2,912.7 | 3,338.8 |
| Depreciation | ||||||||||
| Changes in Account Receivables | ||||||||||
| Changes in Inventories | ||||||||||
| Changes in Accounts Payable | ||||||||||
| Capital Expenditure | ||||||||||
| UFCF | 1,029.1 | 3,792.3 | -2,547.6 | 2,815.0 | 1,677.5 | 2,150.4 | 2,302.1 | 2,638.9 | 3,025.0 | 3,467.5 |
| WACC, % | 7.83 | 7.85 | 7.82 | 7.82 | 7.82 | 7.83 | 7.83 | 7.83 | 7.83 | 7.83 |
| PV UFCF | ||||||||||
| SUM PV UFCF | 10,695.5 | |||||||||
| Long Term Growth Rate, % | 0.50 | |||||||||
| Free cash flow (T + 1) | 3,485 | |||||||||
| Terminal Value | 47,552 | |||||||||
| Present Terminal Value | 32,621 | |||||||||
| Enterprise Value | 43,316 | |||||||||
| Net Debt | -2,846 | |||||||||
| Equity Value | 46,163 | |||||||||
| Diluted Shares Outstanding, MM | 10,811 | |||||||||
| Equity Value Per Share | 4.27 |
What You Will Receive
- Pre-Filled Financial Model: Evergrande’s actual data allows for accurate DCF valuation.
- Comprehensive Forecast Control: Modify revenue growth, profit margins, WACC, and other essential factors.
- Real-Time Calculations: Automatic updates provide immediate feedback as you make adjustments.
- Investor-Ready Template: A polished Excel file crafted for high-standard valuation presentations.
- Customizable and Reusable: Designed for versatility, this template supports ongoing detailed forecasting.
Key Features
- Accurate Evergrande Financials: Access reliable pre-loaded historical data and future forecasts for Evergrande Property Services Group Limited (6666HK).
- Custom Forecast Variables: Modify highlighted fields such as WACC, growth rates, and profit margins to suit your analysis.
- Real-Time Calculations: Benefit from automatic updates to DCF, Net Present Value (NPV), and cash flow assessments.
- Interactive Visual Dashboard: View easy-to-understand charts and summaries to better comprehend your valuation outcomes.
- Designed for Everyone: A user-friendly layout tailored for investors, CFOs, and consultants, regardless of their experience level.
How It Functions
- Download the Template: Gain immediate access to the Excel-based Evergrande DCF Calculator for (6666HK).
- Input Your Assumptions: Modify the yellow-highlighted cells for growth rates, WACC, margins, and additional variables.
- Instant Calculations: The model automatically recalibrates Evergrande’s intrinsic value.
- Test Scenarios: Experiment with various assumptions to assess potential valuation fluctuations.
- Analyze and Decide: Leverage the results to inform your investment or financial analysis decisions.
Why Select This Calculator for Evergrande Property Services Group Limited (6666HK)?
- Precision: Utilizes real financial data from Evergrande for optimal accuracy.
- Adaptability: Users can effortlessly adjust and test various inputs.
- Efficiency: Eliminate the need to create a DCF model from the ground up.
- High-Quality: Crafted with the expertise and standards expected at the CFO level.
- Intuitive: Simple to navigate, catering to both seasoned professionals and novices in financial modeling.
Who Can Benefit from This Product?
- Investors: Evaluate Evergrande Property Services Group Limited’s (6666HK) valuation prior to making investment decisions.
- CFOs and Financial Analysts: Optimize valuation workflows and assess financial forecasts for accuracy.
- Startup Founders: Understand the valuation methods applied to leading companies like Evergrande Property Services Group Limited (6666HK).
- Consultants: Create detailed valuation reports to provide actionable insights for clients.
- Students and Educators: Utilize real-time data to practice and instruct on valuation methodologies.
Contents of the Template
- Pre-Filled Data: Contains historical financials and forecasts for Evergrande Property Services Group Limited (6666HK).
- Discounted Cash Flow Model: An editable DCF valuation model equipped with automatic calculations.
- Weighted Average Cost of Capital (WACC): A specific sheet for determining WACC using customized inputs.
- Key Financial Ratios: Evaluate profitability, efficiency, and leverage of Evergrande Property Services Group Limited (6666HK).
- Customizable Inputs: Easily modify parameters such as revenue growth, margins, and tax rates.
- Clear Dashboard: Visual summaries including charts and tables that highlight key valuation outcomes.
Disclaimer
All information, articles, and product details provided on this website are for general informational and educational purposes only. We do not claim any ownership over, nor do we intend to infringe upon, any trademarks, copyrights, logos, brand names, or other intellectual property mentioned or depicted on this site. Such intellectual property remains the property of its respective owners, and any references here are made solely for identification or informational purposes, without implying any affiliation, endorsement, or partnership.
We make no representations or warranties, express or implied, regarding the accuracy, completeness, or suitability of any content or products presented. Nothing on this website should be construed as legal, tax, investment, financial, medical, or other professional advice. In addition, no part of this site—including articles or product references—constitutes a solicitation, recommendation, endorsement, advertisement, or offer to buy or sell any securities, franchises, or other financial instruments, particularly in jurisdictions where such activity would be unlawful.
All content is of a general nature and may not address the specific circumstances of any individual or entity. It is not a substitute for professional advice or services. Any actions you take based on the information provided here are strictly at your own risk. You accept full responsibility for any decisions or outcomes arising from your use of this website and agree to release us from any liability in connection with your use of, or reliance upon, the content or products found herein.