
|
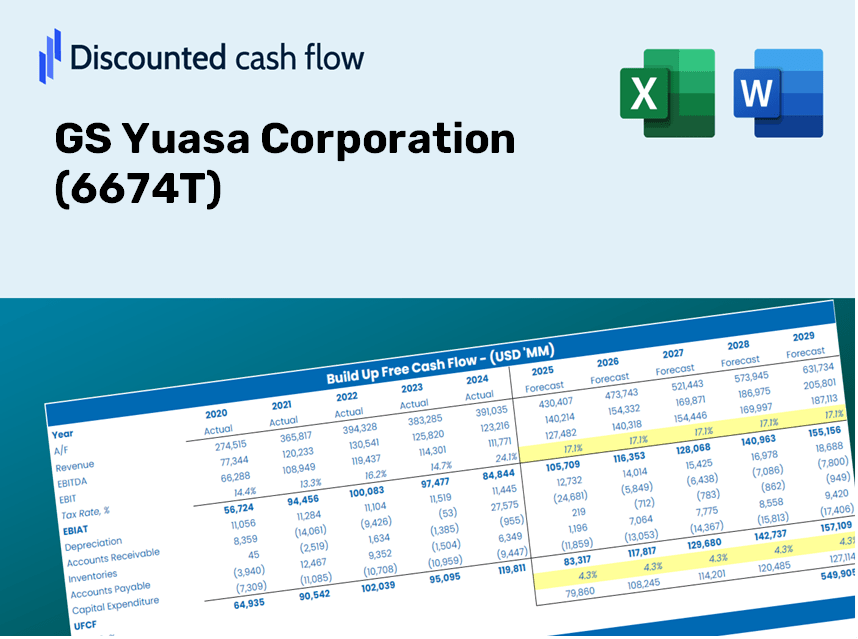
GS Yuasa Corporation (6674.T) DCF Valuation |
Fully Editable: Tailor To Your Needs In Excel Or Sheets
Professional Design: Trusted, Industry-Standard Templates
Investor-Approved Valuation Models
MAC/PC Compatible, Fully Unlocked
No Expertise Is Needed; Easy To Follow
GS Yuasa Corporation (6674.T) Bundle
Looking to assess GS Yuasa Corporation's intrinsic value? Our GS Yuasa Corporation (6674T) DCF Calculator integrates real-world data with comprehensive customization features, allowing you to adjust forecasts and enhance your investment strategies.
Discounted Cash Flow (DCF) - (USD MM)
| Year | AY1 2021 |
AY2 2022 |
AY3 2023 |
AY4 2024 |
AY5 2025 |
FY1 2026 |
FY2 2027 |
FY3 2028 |
FY4 2029 |
FY5 2030 |
|---|---|---|---|---|---|---|---|---|---|---|
| Revenue | 386,511.0 | 432,133.0 | 517,735.0 | 562,897.0 | 580,340.0 | 643,357.0 | 713,216.7 | 790,662.2 | 876,517.3 | 971,695.1 |
| Revenue Growth, % | 0 | 11.8 | 19.81 | 8.72 | 3.1 | 10.86 | 10.86 | 10.86 | 10.86 | 10.86 |
| EBITDA | 45,031.0 | 39,058.0 | 52,763.0 | 69,684.0 | 76,832.0 | 72,697.9 | 80,591.8 | 89,343.0 | 99,044.4 | 109,799.3 |
| EBITDA, % | 11.65 | 9.04 | 10.19 | 12.38 | 13.24 | 11.3 | 11.3 | 11.3 | 11.3 | 11.3 |
| Depreciation | 19,366.0 | 18,866.0 | 21,262.0 | 23,147.0 | 25,066.0 | 28,197.4 | 31,259.3 | 34,653.6 | 38,416.5 | 42,588.0 |
| Depreciation, % | 5.01 | 4.37 | 4.11 | 4.11 | 4.32 | 4.38 | 4.38 | 4.38 | 4.38 | 4.38 |
| EBIT | 25,665.0 | 20,192.0 | 31,501.0 | 46,537.0 | 51,766.0 | 44,500.4 | 49,332.6 | 54,689.4 | 60,627.9 | 67,211.3 |
| EBIT, % | 6.64 | 4.67 | 6.08 | 8.27 | 8.92 | 6.92 | 6.92 | 6.92 | 6.92 | 6.92 |
| Total Cash | 36,280.0 | 25,855.0 | 36,272.0 | 63,935.0 | 60,788.0 | 56,883.4 | 63,060.2 | 69,907.7 | 77,498.7 | 85,914.0 |
| Total Cash, percent | .0 | .0 | .0 | .0 | .0 | .0 | .0 | .0 | .0 | .0 |
| Account Receivables | 78,993.0 | 92,144.0 | 104,059.0 | 110,777.0 | 112,201.0 | 129,794.5 | 143,888.4 | 159,512.7 | 176,833.6 | 196,035.3 |
| Account Receivables, % | 20.44 | 21.32 | 20.1 | 19.68 | 19.33 | 20.17 | 20.17 | 20.17 | 20.17 | 20.17 |
| Inventories | 67,867.0 | 93,050.0 | 110,069.0 | 115,011.0 | 124,737.0 | 131,601.3 | 145,891.4 | 161,733.2 | 179,295.3 | 198,764.3 |
| Inventories, % | 17.56 | 21.53 | 21.26 | 20.43 | 21.49 | 20.46 | 20.46 | 20.46 | 20.46 | 20.46 |
| Accounts Payable | 34,742.0 | 44,174.0 | 51,691.0 | 91,689.0 | 73,728.0 | 74,871.4 | 83,001.4 | 92,014.2 | 102,005.7 | 113,082.1 |
| Accounts Payable, % | 8.99 | 10.22 | 9.98 | 16.29 | 12.7 | 11.64 | 11.64 | 11.64 | 11.64 | 11.64 |
| Capital Expenditure | -19,118.0 | -27,167.0 | -31,551.0 | -38,956.0 | -65,506.0 | -45,723.7 | -50,688.6 | -56,192.7 | -62,294.5 | -69,058.8 |
| Capital Expenditure, % | -4.95 | -6.29 | -6.09 | -6.92 | -11.29 | -7.11 | -7.11 | -7.11 | -7.11 | -7.11 |
| Tax Rate, % | 35.2 | 35.2 | 35.2 | 35.2 | 35.2 | 35.2 | 35.2 | 35.2 | 35.2 | 35.2 |
| EBITAT | 11,832.1 | 8,884.2 | 16,164.3 | 34,789.6 | 33,544.2 | 25,006.7 | 27,722.1 | 30,732.3 | 34,069.4 | 37,768.9 |
| Depreciation | ||||||||||
| Changes in Account Receivables | ||||||||||
| Changes in Inventories | ||||||||||
| Changes in Accounts Payable | ||||||||||
| Capital Expenditure | ||||||||||
| UFCF | -100,037.9 | -28,318.8 | -15,541.7 | 47,318.6 | -36,006.8 | -15,834.0 | -11,961.3 | -13,260.1 | -14,700.0 | -16,296.2 |
| WACC, % | 10.08 | 10.06 | 10.13 | 10.33 | 10.25 | 10.17 | 10.17 | 10.17 | 10.17 | 10.17 |
| PV UFCF | ||||||||||
| SUM PV UFCF | -54,160.9 | |||||||||
| Long Term Growth Rate, % | 2.00 | |||||||||
| Free cash flow (T + 1) | -16,622 | |||||||||
| Terminal Value | -203,417 | |||||||||
| Present Terminal Value | -125,326 | |||||||||
| Enterprise Value | -179,487 | |||||||||
| Net Debt | 54,244 | |||||||||
| Equity Value | -233,731 | |||||||||
| Diluted Shares Outstanding, MM | 100 | |||||||||
| Equity Value Per Share | -2,330.27 |
What You Will Receive
- Customizable Excel Template: A fully adaptable Excel-based DCF Calculator featuring pre-filled financial data for GS Yuasa Corporation (6674T).
- Real-Life Data: Access to historical figures and forward-looking projections (highlighted in the yellow cells).
- Flexible Forecasting: Adjust assumptions for revenue growth, EBITDA margins, and WACC to suit your analysis.
- Instant Calculations: Quickly observe how your inputs influence the valuation of GS Yuasa Corporation (6674T).
- Professional Resource: Designed specifically for investors, CFOs, consultants, and financial analysts.
- User-Centric Design: Organized for easy navigation and comprehension, complete with step-by-step guidance.
Key Features
- Customizable Forecast Settings: Adjust essential inputs such as revenue growth, EBITDA percentage, and capital investments.
- Instant DCF Valuation: Quickly computes intrinsic value, NPV, and additional outputs effortlessly.
- High Precision Accuracy: Leverages GS Yuasa's actual financial data for reliable valuation results.
- Simplified Scenario Analysis: Easily test various assumptions and evaluate outcomes side by side.
- Efficient Valuation Tool: Remove the necessity of creating intricate valuation models from the ground up.
How It Operates
- Step 1: Download the Excel file for GS Yuasa Corporation (6674T).
- Step 2: Examine the pre-filled financial data and forecasts provided for GS Yuasa Corporation.
- Step 3: Adjust key variables such as revenue growth, WACC, and tax rates in the highlighted cells.
- Step 4: Observe the DCF model refresh in real-time as you modify the assumptions.
- Step 5: Evaluate the results and leverage them for your investment strategy.
Why Choose This Calculator for GS Yuasa Corporation (6674T)?
- Precision: Utilizes authentic GS Yuasa financials for reliable data accuracy.
- Customizable: Built for users to easily test and adjust inputs as needed.
- Efficiency: Eliminate the need to create a DCF model from the ground up.
- High-Quality: Engineered with the precision and usability expected from top financial professionals.
- Accessible: Simple to navigate, making it suitable for users with varying levels of financial modeling expertise.
Who Should Benefit from GS Yuasa Corporation (6674T)?
- Finance Students: Master valuation methods and utilize real-world data for practical learning.
- Academics: Integrate advanced financial models into teaching materials or scholarly research.
- Investors: Validate your investment hypotheses and evaluate valuation metrics for GS Yuasa Corporation (6674T).
- Analysts: Enhance your analytical process with a ready-to-use, customizable discounted cash flow (DCF) model.
- Small Business Owners: Discover how large publicly traded companies like GS Yuasa Corporation (6674T) are evaluated in the market.
Contents of the Template
- Preloaded GS Yuasa Data: Historical and forecasted financial information, including revenue, EBIT, and capital expenditures.
- DCF and WACC Models: Advanced sheets designed for calculating intrinsic value and Weighted Average Cost of Capital.
- Editable Inputs: Yellow-highlighted cells allowing modifications for revenue growth, tax rates, and discount rates.
- Financial Statements: Detailed annual and quarterly financial statements for thorough analysis.
- Key Ratios: Metrics for profitability, leverage, and efficiency to assess performance.
- Dashboard and Charts: Visual representations of valuation results and underlying assumptions.
Disclaimer
All information, articles, and product details provided on this website are for general informational and educational purposes only. We do not claim any ownership over, nor do we intend to infringe upon, any trademarks, copyrights, logos, brand names, or other intellectual property mentioned or depicted on this site. Such intellectual property remains the property of its respective owners, and any references here are made solely for identification or informational purposes, without implying any affiliation, endorsement, or partnership.
We make no representations or warranties, express or implied, regarding the accuracy, completeness, or suitability of any content or products presented. Nothing on this website should be construed as legal, tax, investment, financial, medical, or other professional advice. In addition, no part of this site—including articles or product references—constitutes a solicitation, recommendation, endorsement, advertisement, or offer to buy or sell any securities, franchises, or other financial instruments, particularly in jurisdictions where such activity would be unlawful.
All content is of a general nature and may not address the specific circumstances of any individual or entity. It is not a substitute for professional advice or services. Any actions you take based on the information provided here are strictly at your own risk. You accept full responsibility for any decisions or outcomes arising from your use of this website and agree to release us from any liability in connection with your use of, or reliance upon, the content or products found herein.