
|
ULVAC, Inc. (6728.T) DCF Valuation |
Fully Editable: Tailor To Your Needs In Excel Or Sheets
Professional Design: Trusted, Industry-Standard Templates
Investor-Approved Valuation Models
MAC/PC Compatible, Fully Unlocked
No Expertise Is Needed; Easy To Follow
ULVAC, Inc. (6728.T) Bundle
Enhance your investment choices with the ULVAC, Inc. (6728T) DCF Calculator! Explore genuine ULVAC financials, adjust growth predictions and expenses, and instantly observe how these modifications influence ULVAC's intrinsic value.
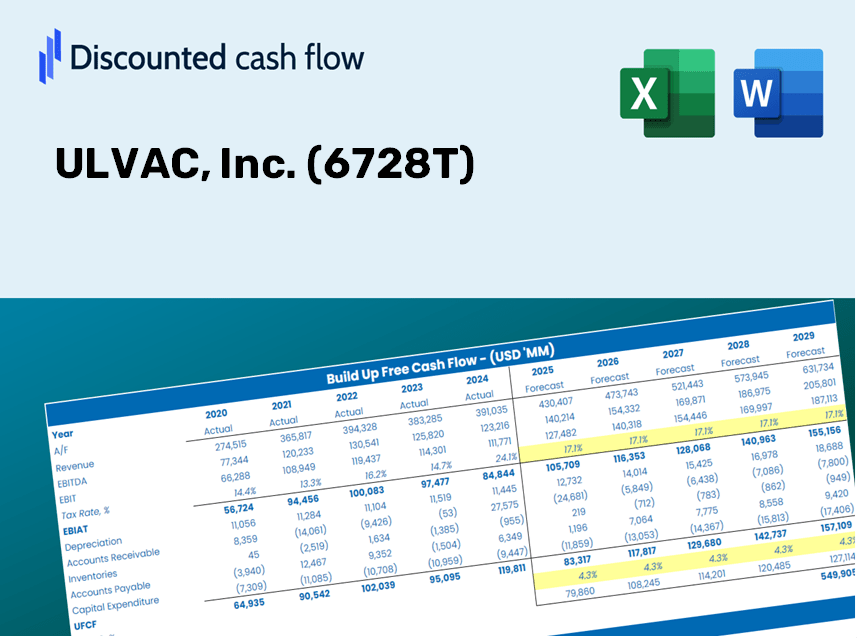
Discounted Cash Flow (DCF) - (USD MM)
| Year | AY1 2020 |
AY2 2021 |
AY3 2022 |
AY4 2023 |
AY5 2024 |
FY1 2025 |
FY2 2026 |
FY3 2027 |
FY4 2028 |
FY5 2029 |
|---|---|---|---|---|---|---|---|---|---|---|
| Revenue | 183,011.0 | 241,260.0 | 227,528.0 | 261,115.0 | 251,184.0 | 274,478.0 | 299,932.3 | 327,747.0 | 358,141.3 | 391,354.2 |
| Revenue Growth, % | 0 | 31.83 | -5.69 | 14.76 | -3.8 | 9.27 | 9.27 | 9.27 | 9.27 | 9.27 |
| EBITDA | 30,443.0 | 38,648.0 | 29,695.0 | 39,204.0 | 38,776.0 | 41,806.4 | 45,683.4 | 49,920.0 | 54,549.4 | 59,608.1 |
| EBITDA, % | 16.63 | 16.02 | 13.05 | 15.01 | 15.44 | 15.23 | 15.23 | 15.23 | 15.23 | 15.23 |
| Depreciation | 8,386.0 | 8,587.0 | 8,245.0 | 9,181.0 | 10,805.0 | 10,750.2 | 11,747.1 | 12,836.5 | 14,026.9 | 15,327.7 |
| Depreciation, % | 4.58 | 3.56 | 3.62 | 3.52 | 4.3 | 3.92 | 3.92 | 3.92 | 3.92 | 3.92 |
| EBIT | 22,057.0 | 30,061.0 | 21,450.0 | 30,023.0 | 27,971.0 | 31,056.3 | 33,936.3 | 37,083.5 | 40,522.5 | 44,280.4 |
| EBIT, % | 12.05 | 12.46 | 9.43 | 11.5 | 11.14 | 11.31 | 11.31 | 11.31 | 11.31 | 11.31 |
| Total Cash | 91,545.0 | 118,040.0 | 98,399.0 | 96,334.0 | 105,951.0 | 121,467.0 | 132,731.4 | 145,040.5 | 158,491.1 | 173,189.1 |
| Total Cash, percent | .0 | .0 | .0 | .0 | .0 | .0 | .0 | .0 | .0 | .0 |
| Account Receivables | 65,970.0 | 85,806.0 | 83,017.0 | 102,789.0 | 84,313.0 | 99,378.0 | 108,594.0 | 118,664.7 | 129,669.3 | 141,694.4 |
| Account Receivables, % | 36.05 | 35.57 | 36.49 | 39.37 | 33.57 | 36.21 | 36.21 | 36.21 | 36.21 | 36.21 |
| Inventories | 37,158.0 | 49,439.0 | 61,960.0 | 69,499.0 | 71,118.0 | 67,497.9 | 73,757.5 | 80,597.5 | 88,071.9 | 96,239.4 |
| Inventories, % | 20.3 | 20.49 | 27.23 | 26.62 | 28.31 | 24.59 | 24.59 | 24.59 | 24.59 | 24.59 |
| Accounts Payable | 36,073.0 | 55,030.0 | 47,336.0 | 46,340.0 | 38,873.0 | 53,000.4 | 57,915.5 | 63,286.4 | 69,155.4 | 75,568.6 |
| Accounts Payable, % | 19.71 | 22.81 | 20.8 | 17.75 | 15.48 | 19.31 | 19.31 | 19.31 | 19.31 | 19.31 |
| Capital Expenditure | -7,147.0 | -7,344.0 | -16,311.0 | -19,881.0 | -11,348.0 | -14,409.9 | -15,746.3 | -17,206.5 | -18,802.2 | -20,545.9 |
| Capital Expenditure, % | -3.91 | -3.04 | -7.17 | -7.61 | -4.52 | -5.25 | -5.25 | -5.25 | -5.25 | -5.25 |
| Tax Rate, % | 38.98 | 38.98 | 38.98 | 38.98 | 38.98 | 38.98 | 38.98 | 38.98 | 38.98 | 38.98 |
| EBITAT | 15,172.6 | 20,750.1 | 14,666.8 | 20,581.2 | 17,068.4 | 20,855.2 | 22,789.2 | 24,902.6 | 27,212.0 | 29,735.6 |
| Depreciation | ||||||||||
| Changes in Account Receivables | ||||||||||
| Changes in Inventories | ||||||||||
| Changes in Accounts Payable | ||||||||||
| Capital Expenditure | ||||||||||
| UFCF | -50,643.4 | 8,833.1 | -10,825.2 | -18,425.8 | 25,915.4 | 19,877.9 | 8,229.6 | 8,992.8 | 9,826.7 | 10,738.0 |
| WACC, % | 7.55 | 7.55 | 7.55 | 7.55 | 7.51 | 7.54 | 7.54 | 7.54 | 7.54 | 7.54 |
| PV UFCF | ||||||||||
| SUM PV UFCF | 47,642.9 | |||||||||
| Long Term Growth Rate, % | 3.50 | |||||||||
| Free cash flow (T + 1) | 11,114 | |||||||||
| Terminal Value | 275,025 | |||||||||
| Present Terminal Value | 191,206 | |||||||||
| Enterprise Value | 238,849 | |||||||||
| Net Debt | -52,352 | |||||||||
| Equity Value | 291,201 | |||||||||
| Diluted Shares Outstanding, MM | 49 | |||||||||
| Equity Value Per Share | 5,911.27 |
What You Will Receive
- Flexible Assumption Inputs: Effortlessly adjust parameters (growth %, margins, WACC) to explore multiple scenarios.
- Pre-Populated Financial Data: ULVAC, Inc.'s financial figures already included to facilitate your analysis.
- Instant DCF Results: The template automatically computes Net Present Value (NPV) and intrinsic value for you.
- Tailored and Professional Design: A refined Excel model that can be customized to fit your valuation requirements.
- Designed for Analysts and Investors: Perfect for evaluating forecasts, confirming strategies, and enhancing efficiency.
Key Features
- Genuine ULVAC Financials: Gain access to precise pre-loaded historical data and forward-looking projections.
- Adjustable Forecast Assumptions: Modify the yellow-highlighted cells, including WACC, growth rates, and profit margins.
- Dynamic Calculations: Automatic updates for DCF, Net Present Value (NPV), and cash flow assessments.
- Visual Dashboard: User-friendly charts and summaries to help you visualize your valuation outcomes.
- Designed for All Skill Levels: An intuitive and straightforward layout tailored for investors, CFOs, and consultants.
How It Functions
- Download: Obtain the pre-configured Excel file containing ULVAC, Inc.'s (6728T) financial information.
- Customize: Modify projections, such as revenue growth rates, EBITDA percentages, and WACC.
- Update Automatically: The intrinsic value and NPV calculations refresh in real-time as you make adjustments.
- Test Scenarios: Generate various forecasts and compare results instantly.
- Make Decisions: Leverage the valuation insights to inform your investment choices.
Why Choose ULVAC, Inc. Calculator?
- Time Efficient: Skip the hassle of building a DCF model – it’s fully prepared for immediate use.
- Enhanced Precision: Dependable financial data and formulas minimize valuation errors.
- Completely Adaptable: Customize the model to align with your specific assumptions and forecasts.
- User-Friendly: Intuitive charts and outputs simplify the analysis of results.
- Preferred by Professionals: Crafted for experts who prioritize accuracy and practicality.
Who Can Benefit from This Product?
- Investors: Assess ULVAC, Inc.'s (6728T) valuation before making stock transactions.
- CFOs and Financial Analysts: Optimize valuation workflows and evaluate forecasts.
- Startup Founders: Discover how prominent public companies like ULVAC, Inc. (6728T) are appraised.
- Consultants: Provide expert valuation analysis and reports for your clients.
- Students and Educators: Utilize real data to practice and instruct on valuation methodologies.
Contents of the Template
- Pre-Filled Data: Contains ULVAC, Inc.’s historical financial performance and projections.
- Discounted Cash Flow Model: A customizable DCF valuation model featuring automatic computational capabilities.
- Weighted Average Cost of Capital (WACC): A specialized worksheet for calculating WACC using specific input values.
- Key Financial Ratios: Evaluate ULVAC, Inc.'s profitability, efficiency, and leverage metrics.
- Customizable Inputs: Easily modify revenue growth rates, profit margins, and tax rates.
- Clear Dashboard: Visual representations and tables summarizing essential valuation outcomes.
Disclaimer
All information, articles, and product details provided on this website are for general informational and educational purposes only. We do not claim any ownership over, nor do we intend to infringe upon, any trademarks, copyrights, logos, brand names, or other intellectual property mentioned or depicted on this site. Such intellectual property remains the property of its respective owners, and any references here are made solely for identification or informational purposes, without implying any affiliation, endorsement, or partnership.
We make no representations or warranties, express or implied, regarding the accuracy, completeness, or suitability of any content or products presented. Nothing on this website should be construed as legal, tax, investment, financial, medical, or other professional advice. In addition, no part of this site—including articles or product references—constitutes a solicitation, recommendation, endorsement, advertisement, or offer to buy or sell any securities, franchises, or other financial instruments, particularly in jurisdictions where such activity would be unlawful.
All content is of a general nature and may not address the specific circumstances of any individual or entity. It is not a substitute for professional advice or services. Any actions you take based on the information provided here are strictly at your own risk. You accept full responsibility for any decisions or outcomes arising from your use of this website and agree to release us from any liability in connection with your use of, or reliance upon, the content or products found herein.