
|
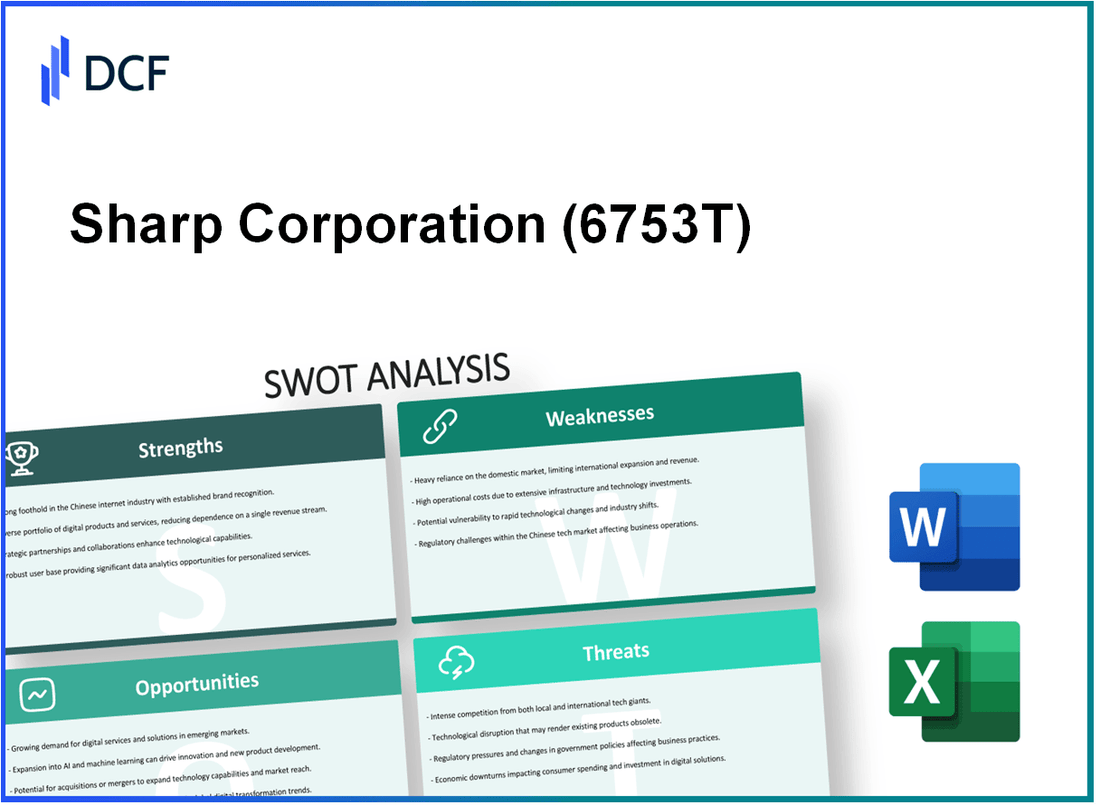
Sharp Corporation (6753.T): SWOT Analysis |
Fully Editable: Tailor To Your Needs In Excel Or Sheets
Professional Design: Trusted, Industry-Standard Templates
Investor-Approved Valuation Models
MAC/PC Compatible, Fully Unlocked
No Expertise Is Needed; Easy To Follow
Sharp Corporation (6753.T) Bundle
In today's hyper-competitive landscape, understanding a company's standing is crucial for strategic planning and growth. Sharp Corporation, known for its innovative electronic products, faces a spectrum of challenges and opportunities. Dive into this SWOT analysis to uncover Sharp's strengths that bolster its market position, the weaknesses that may hinder its progress, the ripe opportunities for expansion, and the threats lurking on the horizon. The insights below promise to illuminate the path forward for this iconic brand.
Sharp Corporation - SWOT Analysis: Strengths
Sharp Corporation has established a formidable presence in the global electronics market, boasting a strong brand reputation, innovative capabilities, and a diverse product range.
Strong brand reputation in electronic products
Sharp Corporation is recognized for its commitment to quality and innovation in consumer electronics. In 2022, the company's brand value was estimated at approximately $1.8 billion, according to Brand Finance. This ranking places Sharp as one of the top electronics brands globally, underscoring its reputation in the industry.
Advanced technology and innovation capabilities
Sharp has consistently invested in advanced technologies to maintain its competitive edge. In the fiscal year ending March 2023, the company reported research and development (R&D) expenditures of around $1.1 billion, which represented about 6.5% of its total sales revenue. This investment has resulted in numerous patents, with over 31,000 patents registered worldwide, emphasizing its commitment to innovation.
Established global distribution network
Sharp operates a robust global distribution network that enhances its market reach. The company boasts over 54 subsidiaries worldwide, enabling it to penetrate various regional markets effectively. The distribution channels include partnerships with major retailers and online platforms, significantly broadening its accessibility to consumers.
Diverse product portfolio spanning consumer electronics and business solutions
Sharp's product portfolio includes a wide range of offerings, from consumer electronics like TVs and home appliances to business solutions such as commercial displays and medical equipment. In the fiscal year 2023, the revenue breakdown was as follows:
| Product Category | Revenue (in billion $) | Percentage of Total Revenue |
|---|---|---|
| Consumer Electronics | 5.5 | 40% |
| Business Solutions | 4.0 | 30% |
| Display Systems | 2.5 | 18% |
| Others | 1.5 | 12% |
Strong R&D investment leading to product improvements
Sharp's dedication to R&D has yielded significant advancements in product offerings. The company has recently introduced OLED display technology and AI-driven home appliances, positioning itself at the forefront of innovation. The strong R&D focus is evidenced by the notable improvements in product performance, contributing to enhanced customer satisfaction and loyalty.
In the last fiscal year, Sharp's innovations in product lines contributed to a revenue increase of 15% in smart home products, showcasing the direct benefits of its research initiatives.
Sharp Corporation - SWOT Analysis: Weaknesses
Sharp Corporation exhibits several notable weaknesses that impact its competitive position in the global market. One primary concern is its high dependency on the Japanese market. As of the latest reports, approximately 64% of Sharp's sales are generated within Japan. This heavy reliance makes the company susceptible to domestic economic fluctuations and changes in consumer behavior.
Additionally, Sharp holds a limited market share in highly competitive segments such as smartphones. According to data from IDC, Sharp's share of the global smartphone market was merely 1.2% in 2023, significantly trailing behind larger competitors like Apple and Samsung, which dominate with shares of 26% and 21% respectively.
Furthermore, Sharp is vulnerable to fluctuations in raw material prices. The company relies heavily on components such as lithium and cobalt for its electronics production. The prices of these materials have shown significant volatility, with lithium reaching a peak of $80,000 per ton in late 2021 before stabilizing around $40,000 in early 2023. Such price swings can severely impact production costs and overall profitability.
Sharp also faces challenges in maintaining profitability consistently. The company's operating income for the fiscal year 2022 was reported at ¥33.7 billion, representing a decline of 6.5% compared to the previous year. This indicates struggles in sustaining growth amidst stiff competition and rising operational costs.
Lastly, the company demonstrates a relatively slower adaptation to market trends compared to competitors. In 2023, Sharp was late to adopt OLED technology in its product lines, missing out on market opportunities as competitors like LG and Samsung surged ahead. This delay has resulted in a gap in product offerings, which could lead to a loss of market relevance.
| Weakness | Details | Relevant Data |
|---|---|---|
| High dependency on the Japanese market | Sales concentration in Japan | Approximately 64% of sales from Japan |
| Limited market share in smartphones | Global smartphone market share | 1.2% share in 2023 |
| Vulnerability to raw material price fluctuations | Dependence on lithium and cobalt | Lithium prices peaked at $80,000 per ton |
| Challenges in maintaining profitability | Operating income decline | Reported ¥33.7 billion in operating income for 2022 |
| Slower adaptation to market trends | Delayed in adopting OLED technology | Late entry compared to LG and Samsung |
Sharp Corporation - SWOT Analysis: Opportunities
Sharp Corporation is strategically positioned to leverage several opportunities in the market, providing potential pathways for growth and revenue enhancement.
Growing demand for smart home and IoT solutions
The global smart home market is anticipated to reach $174 billion by 2025, expanding at a CAGR of approximately 27% from 2020. Sharp can capitalize on this trend by enhancing its IoT offerings, especially in connected appliances.
Expansion potential in emerging markets
Emerging markets represent a significant growth opportunity for Sharp Corporation. The Asia-Pacific region is projected to witness a growth increase of 9% annually in household appliance spending from 2021 to 2025. This presents a ripe opportunity for Sharp to establish a deeper market presence.
Increasing consumer interest in energy-efficient appliances
According to the International Energy Agency (IEA), the market for energy-efficient appliances is projected to grow by 50% by 2030. This aligns with global sustainability trends, enabling Sharp to develop innovative products that align with consumer demand for eco-friendly solutions.
Partnerships with tech innovators for co-developed products
Collaborations with technology firms can enhance Sharp’s product offerings. For instance, partnerships like the one with Qualcomm aim to integrate advanced connectivity features, targeting a market that’s expected to reach $30 billion in value by 2025.
Opportunities in healthcare technology innovations
The healthcare technology market is estimated to reach $612 billion by 2025, expanding at a CAGR of 24%. Sharp’s entry into this sector, particularly with products like smart medical devices, aligns with its expertise in electronics and can provide substantial growth avenues.
| Opportunity Area | Market Size/Value | Growth Rate (CAGR) | Forecast Year |
|---|---|---|---|
| Smart Home Market | $174 billion | 27% | 2025 |
| Energy-efficient Appliances | Projected 50% increase | N/A | By 2030 |
| Healthcare Technology Market | $612 billion | 24% | 2025 |
| Partnerships with Tech Innovators | $30 billion industry | N/A | 2025 |
| Emerging Markets Growth | 9% annual increase | 9% | 2025 |
By strategically positioning itself within these growing segments, Sharp Corporation can leverage these opportunities to enhance its market share and drive future growth.
Sharp Corporation - SWOT Analysis: Threats
Intense competition from global electronics manufacturers poses a significant threat to Sharp Corporation. Major competitors such as Samsung, LG, and Sony consistently capture market share and innovate rapidly. In fiscal year 2022, Samsung Electronics reported sales of approximately $244 billion, while LG Electronics posted revenues of around $62 billion. The competitive pressures in the consumer electronics sector are heightened by the low barriers to entry and the constant influx of new technologies.
Rapid technological changes require quick adaptation and pose a threat to Sharp's market position. For instance, the global market for OLED displays is projected to grow from $25.5 billion in 2022 to over $50 billion by 2027, reflecting a CAGR of 15.1%. Companies that fail to keep pace with these advancements risk losing relevance.
Economic instability impacts consumer purchasing power significantly. The inflation rate in Japan reached approximately 3.2% in September 2023, while the US inflation was reported at 3.7% for the same period. These economic conditions can lead to decreased consumer spending, adversely affecting sales in the electronics market.
Supply chain disruptions have been a major challenge in recent years. Semiconductor shortages, for example, have affected many manufacturers, including Sharp. In 2021, the global semiconductor shortage was projected to cost the automotive industry alone around $210 billion in lost revenues. This situation similarly impacts Sharp's ability to produce and deliver products on time, affecting its overall profitability.
Regulatory challenges in various international markets add layers of complexity to Sharp's operations. For instance, the recent implementation of the Digital Services Act in the European Union could impose compliance costs that affect Sharp's business model. Non-compliance fines can reach up to €20 million or 4% of annual global turnover, whichever is higher, which could significantly affect the bottom line. Moreover, tariffs and trade restrictions, especially between the US and China, can adversely influence Sharp's export routes and overall market competitiveness.
| Threat | Data/Statistics | Impact |
|---|---|---|
| Competition | Samsung: $244B revenue (2022) LG: $62B revenue (2022) |
Market share erosion |
| Technological Changes | OLED market growth from $25.5B (2022) to $50B (2027) | Need for rapid adaptation |
| Economic Instability | Japan inflation: 3.2% (Sept 2023) US inflation: 3.7% (Sept 2023) |
Decreased consumer spending |
| Supply Chain Disruptions | Semiconductor shortage cost: $210B (automotive industry 2021) | Production delays |
| Regulatory Challenges | Digital Services Act compliance fines up to €20M or 4% of revenue | Increased operational costs |
The SWOT analysis of Sharp Corporation reveals a multifaceted landscape of strengths, weaknesses, opportunities, and threats that can significantly influence its strategic direction and competitive edge in the ever-evolving electronics market. By leveraging its strong brand and innovative capabilities while addressing market vulnerabilities, Sharp can position itself to capitalize on emerging trends and navigate potential challenges effectively.
Disclaimer
All information, articles, and product details provided on this website are for general informational and educational purposes only. We do not claim any ownership over, nor do we intend to infringe upon, any trademarks, copyrights, logos, brand names, or other intellectual property mentioned or depicted on this site. Such intellectual property remains the property of its respective owners, and any references here are made solely for identification or informational purposes, without implying any affiliation, endorsement, or partnership.
We make no representations or warranties, express or implied, regarding the accuracy, completeness, or suitability of any content or products presented. Nothing on this website should be construed as legal, tax, investment, financial, medical, or other professional advice. In addition, no part of this site—including articles or product references—constitutes a solicitation, recommendation, endorsement, advertisement, or offer to buy or sell any securities, franchises, or other financial instruments, particularly in jurisdictions where such activity would be unlawful.
All content is of a general nature and may not address the specific circumstances of any individual or entity. It is not a substitute for professional advice or services. Any actions you take based on the information provided here are strictly at your own risk. You accept full responsibility for any decisions or outcomes arising from your use of this website and agree to release us from any liability in connection with your use of, or reliance upon, the content or products found herein.