
|
Sun Art Retail Group Limited (6808.HK) DCF Valuation |
Fully Editable: Tailor To Your Needs In Excel Or Sheets
Professional Design: Trusted, Industry-Standard Templates
Investor-Approved Valuation Models
MAC/PC Compatible, Fully Unlocked
No Expertise Is Needed; Easy To Follow
Sun Art Retail Group Limited (6808.HK) Bundle
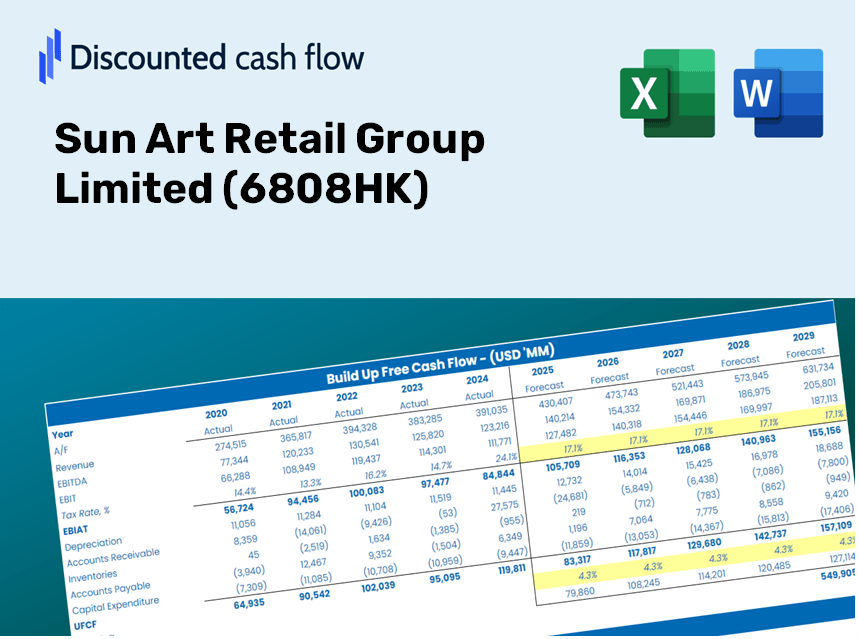
Gain insights into your Sun Art Retail Group Limited (6808HK) valuation analysis using our cutting-edge DCF Calculator! This Excel template comes preloaded with real (6808HK) data, enabling you to adjust forecasts and assumptions for a precise calculation of Sun Art Retail Group Limited's intrinsic value.
Discounted Cash Flow (DCF) - (USD MM)
| Year | AY1 2020 |
AY2 2021 |
AY3 2022 |
AY4 2023 |
AY5 2024 |
FY1 2025 |
FY2 2026 |
FY3 2027 |
FY4 2028 |
FY5 2029 |
|---|---|---|---|---|---|---|---|---|---|---|
| Revenue | 108,902.8 | 96,279.2 | 91,393.9 | 79,273.5 | 78,164.7 | 72,043.3 | 66,401.2 | 61,200.9 | 56,408.0 | 51,990.4 |
| Revenue Growth, % | 0 | -11.59 | -5.07 | -13.26 | -1.4 | -7.83 | -7.83 | -7.83 | -7.83 | -7.83 |
| EBITDA | 7,798.1 | 3,836.6 | 5,248.0 | 2,609.8 | 4,930.1 | 3,816.4 | 3,517.5 | 3,242.1 | 2,988.2 | 2,754.1 |
| EBITDA, % | 7.16 | 3.98 | 5.74 | 3.29 | 6.31 | 5.3 | 5.3 | 5.3 | 5.3 | 5.3 |
| Depreciation | 4,430.8 | 4,229.8 | -348.5 | 3,712.0 | 3,373.4 | 2,460.8 | 2,268.1 | 2,090.5 | 1,926.8 | 1,775.9 |
| Depreciation, % | 4.07 | 4.39 | -0.3813 | 4.68 | 4.32 | 3.42 | 3.42 | 3.42 | 3.42 | 3.42 |
| EBIT | 3,367.3 | -393.3 | 5,596.5 | -1,102.3 | 1,556.7 | 1,355.6 | 1,249.4 | 1,151.6 | 1,061.4 | 978.3 |
| EBIT, % | 3.09 | -0.40847 | 6.12 | -1.39 | 1.99 | 1.88 | 1.88 | 1.88 | 1.88 | 1.88 |
| Total Cash | 21,975.1 | 20,383.4 | 20,951.5 | 17,939.7 | 14,438.5 | 15,183.3 | 13,994.2 | 12,898.2 | 11,888.1 | 10,957.1 |
| Total Cash, percent | .0 | .0 | .0 | .0 | .0 | .0 | .0 | .0 | .0 | .0 |
| Account Receivables | 1,494.4 | 2,073.4 | .0 | 1,298.9 | 2,477.6 | 1,200.8 | 1,106.8 | 1,020.1 | 940.2 | 866.6 |
| Account Receivables, % | 1.37 | 2.15 | 0 | 1.64 | 3.17 | 1.67 | 1.67 | 1.67 | 1.67 | 1.67 |
| Inventories | 10,913.3 | 10,621.6 | 9,257.2 | 8,401.8 | 8,157.1 | 7,523.7 | 6,934.4 | 6,391.4 | 5,890.8 | 5,429.5 |
| Inventories, % | 10.02 | 11.03 | 10.13 | 10.6 | 10.44 | 10.44 | 10.44 | 10.44 | 10.44 | 10.44 |
| Accounts Payable | 14,474.5 | 14,147.9 | 12,538.8 | 11,265.0 | 10,740.7 | 10,036.6 | 9,250.6 | 8,526.1 | 7,858.4 | 7,243.0 |
| Accounts Payable, % | 13.29 | 14.69 | 13.72 | 14.21 | 13.74 | 13.93 | 13.93 | 13.93 | 13.93 | 13.93 |
| Capital Expenditure | .0 | -13.1 | -19.7 | -20.8 | -13.1 | -11.3 | -10.4 | -9.6 | -8.8 | -8.1 |
| Capital Expenditure, % | 0 | -0.01361563 | -0.02151514 | -0.0261827 | -0.01677102 | -0.0156169 | -0.0156169 | -0.0156169 | -0.0156169 | -0.0156169 |
| Tax Rate, % | 60.68 | 60.68 | 60.68 | 60.68 | 60.68 | 60.68 | 60.68 | 60.68 | 60.68 | 60.68 |
| EBITAT | 2,370.5 | -645.8 | 844.9 | -1,233.7 | 612.1 | 880.6 | 811.7 | 748.1 | 689.5 | 635.5 |
| Depreciation | ||||||||||
| Changes in Account Receivables | ||||||||||
| Changes in Inventories | ||||||||||
| Changes in Accounts Payable | ||||||||||
| Capital Expenditure | ||||||||||
| UFCF | 8,868.2 | 2,957.0 | 2,305.5 | 740.3 | 2,514.0 | 4,536.4 | 2,966.7 | 2,734.3 | 2,520.2 | 2,322.8 |
| WACC, % | 8.34 | 8.84 | 7.4 | 8.84 | 7.81 | 8.24 | 8.24 | 8.24 | 8.24 | 8.24 |
| PV UFCF | ||||||||||
| SUM PV UFCF | 12,277.7 | |||||||||
| Long Term Growth Rate, % | 2.00 | |||||||||
| Free cash flow (T + 1) | 2,369 | |||||||||
| Terminal Value | 37,946 | |||||||||
| Present Terminal Value | 25,536 | |||||||||
| Enterprise Value | 37,813 | |||||||||
| Net Debt | 575 | |||||||||
| Equity Value | 37,239 | |||||||||
| Diluted Shares Outstanding, MM | 9,540 | |||||||||
| Equity Value Per Share | 3.90 |
What You Will Receive
- Authentic SUN ART Financials: Access to historical and projected data for precise valuation.
- Customizable Inputs: Adjust parameters such as WACC, tax rates, revenue growth, and capital expenditures.
- Real-Time Calculations: Intrinsic value and NPV are computed automatically.
- Scenario Analysis: Explore multiple scenarios to assess Sun Art Retail Group's future performance.
- User-Friendly Design: Crafted for professionals while remaining approachable for newcomers.
Key Features
- Comprehensive Historical Data: Pre-loaded with Sun Art Retail Group's historical performance metrics and future forecasts.
- Customizable Parameters: Tailor inputs such as revenue growth, profit margins, discount rates, tax rates, and capital investments.
- Interactive Valuation Model: Automatically recalculates Net Present Value (NPV) and intrinsic value based on your modifications.
- Scenario Analysis: Develop various forecasting scenarios to explore different valuation results.
- Intuitive Interface: Designed for ease of use, making it accessible for both experts and newcomers.
How It Functions
- Step 1: Download the Excel spreadsheet.
- Step 2: Examine the pre-filled Sun Art Retail Group data (historical and forecasted).
- Step 3: Modify essential assumptions (highlighted in yellow) based on your insights.
- Step 4: Observe real-time updates reflecting Sun Art's intrinsic value.
- Step 5: Utilize the results for investment strategies or reporting purposes.
Why Choose This Calculator for Sun Art Retail Group Limited (6808HK)?
- Designed for Experts: A sophisticated tool tailored for analysts, CFOs, and consultants in retail.
- Accurate Data: Sun Art’s historical and projected financials preloaded for reliable analysis.
- Flexible Scenario Analysis: Effortlessly test various forecasts and assumptions.
- Comprehensive Outputs: Automatically calculates intrinsic value, NPV, and essential performance metrics.
- User-Friendly: Clear, step-by-step instructions ensure a smooth experience.
Who Can Benefit from This Product?
- Investors: Assess Sun Art Retail Group Limited’s (6808HK) valuation prior to making stock transactions.
- CFOs and Financial Analysts: Optimize valuation workflows and evaluate financial forecasts.
- Startup Founders: Understand the valuation methods applied to major retailers like Sun Art Retail Group Limited (6808HK).
- Consultants: Generate comprehensive valuation reports for your clients based on Sun Art Retail Group Limited (6808HK).
- Students and Educators: Utilize real-world data from Sun Art Retail Group Limited (6808HK) to practice and teach valuation methodologies.
Contents of the Template
- Historical Data: Features Sun Art Retail Group Limited's (6808HK) past financial figures and baseline forecasts.
- DCF and Levered DCF Models: Comprehensive templates for estimating the intrinsic value of Sun Art Retail Group Limited (6808HK).
- WACC Sheet: Pre-configured calculations for the Weighted Average Cost of Capital.
- Editable Inputs: Adjust essential parameters such as growth rates, EBITDA percentages, and CAPEX assumptions.
- Quarterly and Annual Statements: An exhaustive overview of Sun Art Retail Group Limited's (6808HK) financial statements.
- Interactive Dashboard: Dynamically visualize valuation outcomes and future projections.
Disclaimer
All information, articles, and product details provided on this website are for general informational and educational purposes only. We do not claim any ownership over, nor do we intend to infringe upon, any trademarks, copyrights, logos, brand names, or other intellectual property mentioned or depicted on this site. Such intellectual property remains the property of its respective owners, and any references here are made solely for identification or informational purposes, without implying any affiliation, endorsement, or partnership.
We make no representations or warranties, express or implied, regarding the accuracy, completeness, or suitability of any content or products presented. Nothing on this website should be construed as legal, tax, investment, financial, medical, or other professional advice. In addition, no part of this site—including articles or product references—constitutes a solicitation, recommendation, endorsement, advertisement, or offer to buy or sell any securities, franchises, or other financial instruments, particularly in jurisdictions where such activity would be unlawful.
All content is of a general nature and may not address the specific circumstances of any individual or entity. It is not a substitute for professional advice or services. Any actions you take based on the information provided here are strictly at your own risk. You accept full responsibility for any decisions or outcomes arising from your use of this website and agree to release us from any liability in connection with your use of, or reliance upon, the content or products found herein.