
|
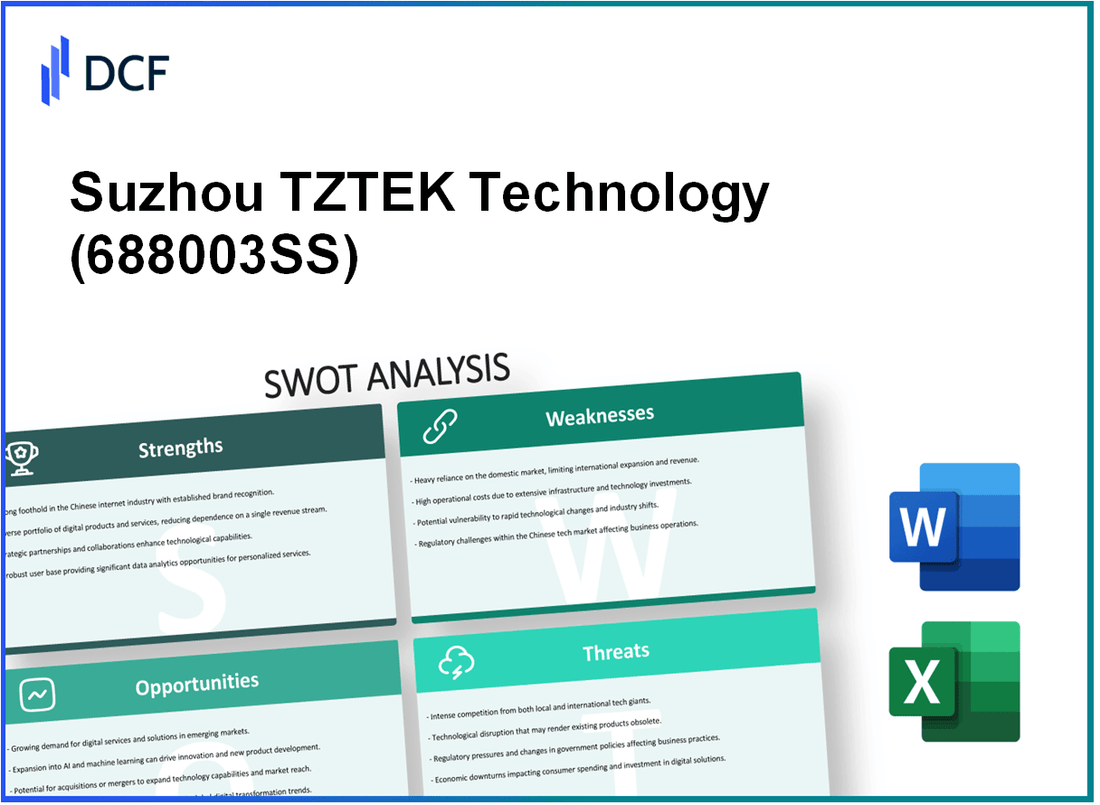
Suzhou TZTEK Technology Co., Ltd (688003.SS): SWOT Analysis |
Fully Editable: Tailor To Your Needs In Excel Or Sheets
Professional Design: Trusted, Industry-Standard Templates
Investor-Approved Valuation Models
MAC/PC Compatible, Fully Unlocked
No Expertise Is Needed; Easy To Follow
Suzhou TZTEK Technology Co., Ltd (688003.SS) Bundle
In the fast-evolving landscape of technology, Suzhou TZTEK Technology Co., Ltd stands at a critical juncture, balancing innovation against formidable challenges. This SWOT analysis delves into the strengths that propel the company forward, the weaknesses that hinder its potential, the opportunities ripe for the taking, and the threats lurking in the competitive shadows. Join us as we unpack these dynamics to understand TZTEK's strategic positioning and future prospects.
Suzhou TZTEK Technology Co., Ltd - SWOT Analysis: Strengths
Suzhou TZTEK Technology Co., Ltd showcases remarkable strengths that enhance its position in the competitive landscape of technology solutions. One of its primary advantages is its strong R&D capabilities, which contribute significantly to innovation.
The company invests approximately 8% of its total revenue annually into research and development, positioning it well to develop cutting-edge technology solutions. In 2022, TZTEK reported total revenue of ¥1.5 billion, indicating a significant investment of about ¥120 million in R&D.
Another critical strength is TZTEK’s established brand presence in the Chinese market. According to a recent market analysis, TZTEK ranks among the top 5% of technology firms in China based on brand recognition. This strong presence allows the company to leverage consumer trust and loyalty.
TZTEK specializes in automation and intelligent manufacturing systems, a sector that sees robust growth. The global market for automation technologies is projected to reach USD 500 billion by 2025, with TZTEK positioned to capture a significant market share due to its advanced solutions. In specific terms, the demand for their intelligent manufacturing systems grew by 15% year-on-year in 2022.
Moreover, TZTEK has cultivated robust partnerships with key players in the tech industry, including alliances with multinational corporations like Huawei and Siemens. These partnerships not only expand TZTEK’s technological capabilities but also enhance its market reach. Notably, revenues generated through partnerships accounted for about 30% of total sales in 2022, underlining the financial significance of these collaborations.
| Key Strengths | Details |
|---|---|
| R&D Investment | ¥120 million in 2022, representing 8% of total revenue |
| Brand Recognition | Ranked in the top 5% of Chinese technology firms |
| Market Growth in Automation | Global market projected to reach USD 500 billion by 2025 |
| Year-on-Year Demand Growth | 15% growth in intelligent manufacturing systems in 2022 |
| Partnership Revenues | Partnerships contributed 30% of total sales in 2022 |
Suzhou TZTEK Technology Co., Ltd - SWOT Analysis: Weaknesses
Limited global market penetration compared to competitors. As of 2023, TZTEK has primarily focused its operations within the domestic Chinese market, capturing around 10% of the global market share in its respective technology sector. Competitors such as Huawei and ZTE have achieved a global market penetration rate exceeding 30%, highlighting TZTEK's struggle to establish a significant international presence.
Heavy reliance on the Chinese market for revenue. TZTEK derives approximately 85% of its total revenue from domestic sales. In the latest financial report, the company reported total revenues of approximately CNY 1.5 billion in 2022, with CNY 1.275 billion generated from the Chinese market. This dependency increases vulnerability to domestic economic fluctuations and regulatory changes.
Potential vulnerabilities in supply chain management. The company sources its materials from a limited number of suppliers concentrated in China. This reliance has been a significant concern, especially during disruptions such as the global semiconductor shortage, which affected operational capacity. As of Q3 2023, TZTEK reported delays in production due to supply chain constraints, impacting approximately 20% of its planned output.
| Year | Total Revenue (CNY) | Revenue from China (CNY) | Global Market Share (%) |
|---|---|---|---|
| 2020 | 1.2 billion | 1.0 billion | 8% |
| 2021 | 1.35 billion | 1.15 billion | 9% |
| 2022 | 1.50 billion | 1.275 billion | 10% |
| 2023 (Projected) | 1.65 billion | 1.40 billion | 10% |
High research and development costs impacting profit margins. In 2022, TZTEK invested roughly CNY 200 million in R&D, representing around 13% of total revenue. This high expenditure has pressured profit margins, which stood at 6% in 2022, down from 8% in 2021. Continued innovation is critical, but the associated costs may hinder financial stability if revenue growth does not keep pace.
Suzhou TZTEK Technology Co., Ltd - SWOT Analysis: Opportunities
The global demand for automation technologies is surging, driven by the need for greater productivity and efficiency in various industries. According to a report by Fortune Business Insights, the global industrial automation market is projected to grow from USD 175.84 billion in 2022 to USD 296.70 billion by 2029, demonstrating a compound annual growth rate (CAGR) of 7.71%. This trend presents a significant opportunity for Suzhou TZTEK Technology Co., Ltd to expand its product offerings and capture new clientele.
Emerging markets represent another key opportunity for Suzhou TZTEK. Markets in Asia-Pacific, particularly India and Southeast Asia, are experiencing rapid industrialization. According to the Asian Development Bank, India's manufacturing sector is expected to reach USD 1 trillion by 2025. This growth can be leveraged by TZTEK through tailored technological offerings that meet local demands.
Strategic alliances can fuel innovation and growth for TZTEK. Collaborations with technology firms and research institutions can enhance product development and market reach. A recent analysis by Deloitte emphasized that companies engaging in strategic alliances could improve performance by over 30%. TZTEK could benefit from partnerships that foster collaboration on emerging technologies, particularly in areas related to automation and AI.
Additionally, the increasing interest in artificial intelligence (AI) and machine learning applications presents a substantial opportunity. The global AI market was valued at around USD 136.55 billion in 2022, with expectations to grow at a CAGR of 38.1% from 2023 to 2030, according to Grand View Research. TZTEK can capitalize on this trend by integrating AI into its automation solutions, thus enhancing product efficiency and versatility.
| Opportunity | Market Size (2022) | Projected Growth (CAGR) | Projected Market Size (2029) |
|---|---|---|---|
| Industrial Automation | USD 175.84 billion | 7.71% | USD 296.70 billion |
| India's Manufacturing Sector | USD 400 billion | N/A | USD 1 trillion (by 2025) |
| Global AI Market | USD 136.55 billion | 38.1% | Over USD 1 trillion (by 2030) |
These factors highlight a myriad of opportunities for Suzhou TZTEK Technology Co., Ltd to innovate and expand its market presence. By capitalizing on these trends, the company can strengthen its competitive position and drive sustainable growth in the automation industry.
Suzhou TZTEK Technology Co., Ltd - SWOT Analysis: Threats
The competitive landscape for Suzhou TZTEK Technology Co., Ltd is increasingly challenging due to intense competition from both domestic and international tech firms. The global tech market is projected to grow from $5 trillion in 2021 to approximately $8 trillion by 2025, attracting numerous players. Companies like Huawei, Alibaba, and international firms such as Cisco and IBM are continuously innovating and expanding their market shares.
Furthermore, the rapid pace of technological changes imposes a significant threat. The semiconductor industry alone, critical to TZTEK's operations, is experiencing a shift towards advanced technologies such as AI and machine learning, with market size expected to reach $1 trillion by 2030. Failing to keep pace with these advancements can lead to obsolescence.
Regulatory challenges and trade tensions particularly impact operations in China. The ongoing U.S.-China trade disputes have already resulted in tariffs affecting electronic components. In 2022, the U.S. government imposed tariffs as high as 25% on certain tech imports, complicating supply chain logistics for companies like TZTEK, which rely on both local and international suppliers.
Lastly, economic downturns pose a serious risk, as they can significantly impact customer spending on technology. The global economic outlook for 2023 indicates a potential recession, with growth expected to slow to 1.5% from 3.2% in 2022. Such economic pressures often result in reduced capital expenditures by businesses, leading to a decline in demand for technological solutions.
| Threat Type | Description | Impacts on Suzhou TZTEK |
|---|---|---|
| Intense Competition | Competition from firms like Huawei, Alibaba, Cisco, and IBM. | Pressure on pricing and market share, leading to potential revenue decline. |
| Rapid Technological Changes | Shift towards AI, machine learning, and advanced semiconductor technology. | Increased R&D spending needed to remain competitive. |
| Regulatory Challenges | U.S.-China trade tensions and tariffs impacting operations. | Complicated supply chains and increased costs due to tariffs. |
| Economic Downturns | Slowing global economic growth affecting customer spending. | Potential decrease in sales and profitability. |
In summary, Suzhou TZTEK Technology Co., Ltd stands at a pivotal crossroads, leveraging its strong R&D capabilities and established market presence while navigating challenges like limited global reach and intense competition. With a keen eye on emerging opportunities in automation and AI, the company has the potential to adapt and thrive in a rapidly evolving tech landscape, balancing innovation with strategic growth.
Disclaimer
All information, articles, and product details provided on this website are for general informational and educational purposes only. We do not claim any ownership over, nor do we intend to infringe upon, any trademarks, copyrights, logos, brand names, or other intellectual property mentioned or depicted on this site. Such intellectual property remains the property of its respective owners, and any references here are made solely for identification or informational purposes, without implying any affiliation, endorsement, or partnership.
We make no representations or warranties, express or implied, regarding the accuracy, completeness, or suitability of any content or products presented. Nothing on this website should be construed as legal, tax, investment, financial, medical, or other professional advice. In addition, no part of this site—including articles or product references—constitutes a solicitation, recommendation, endorsement, advertisement, or offer to buy or sell any securities, franchises, or other financial instruments, particularly in jurisdictions where such activity would be unlawful.
All content is of a general nature and may not address the specific circumstances of any individual or entity. It is not a substitute for professional advice or services. Any actions you take based on the information provided here are strictly at your own risk. You accept full responsibility for any decisions or outcomes arising from your use of this website and agree to release us from any liability in connection with your use of, or reliance upon, the content or products found herein.