
|
Shanghai MicroPort Endovascular MedTech Co., Ltd. (688016.SS) DCF Valuation |
Fully Editable: Tailor To Your Needs In Excel Or Sheets
Professional Design: Trusted, Industry-Standard Templates
Investor-Approved Valuation Models
MAC/PC Compatible, Fully Unlocked
No Expertise Is Needed; Easy To Follow
Shanghai MicroPort Endovascular MedTech Co., Ltd. (688016.SS) Bundle
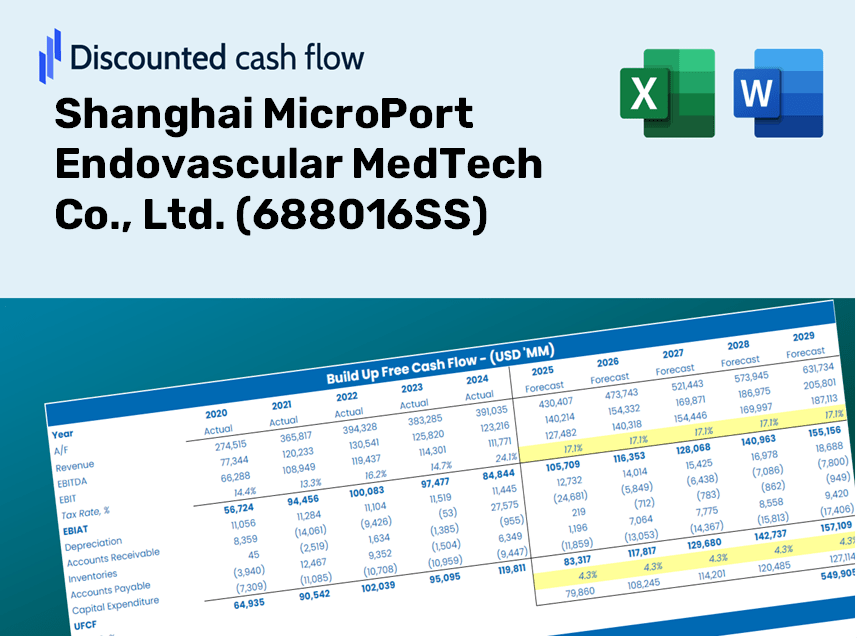
Evaluate the financial outlook of Shanghai MicroPort Endovascular MedTech Co., Ltd. (688016SS) like an expert! This (688016SS) DCF Calculator provides pre-filled financial data along with the flexibility to modify revenue growth, WACC, margins, and other essential assumptions to align with your projections.
Discounted Cash Flow (DCF) - (USD MM)
| Year | AY1 2020 |
AY2 2021 |
AY3 2022 |
AY4 2023 |
AY5 2024 |
FY1 2025 |
FY2 2026 |
FY3 2027 |
FY4 2028 |
FY5 2029 |
|---|---|---|---|---|---|---|---|---|---|---|
| Revenue | 470.3 | 684.6 | 896.5 | 1,187.2 | 1,206.3 | 1,539.8 | 1,965.4 | 2,508.7 | 3,202.2 | 4,087.4 |
| Revenue Growth, % | 0 | 45.59 | 30.95 | 32.43 | 1.61 | 27.64 | 27.64 | 27.64 | 27.64 | 27.64 |
| EBITDA | 227.9 | 333.4 | 395.9 | 556.0 | 553.6 | 720.8 | 920.1 | 1,174.4 | 1,499.1 | 1,913.4 |
| EBITDA, % | 48.47 | 48.7 | 44.16 | 46.84 | 45.9 | 46.81 | 46.81 | 46.81 | 46.81 | 46.81 |
| Depreciation | 13.9 | 15.5 | 22.7 | 24.0 | 34.4 | 38.9 | 49.6 | 63.3 | 80.8 | 103.2 |
| Depreciation, % | 2.96 | 2.26 | 2.53 | 2.02 | 2.86 | 2.52 | 2.52 | 2.52 | 2.52 | 2.52 |
| EBIT | 214.0 | 318.0 | 373.3 | 532.0 | 519.2 | 681.9 | 870.5 | 1,111.1 | 1,418.2 | 1,810.2 |
| EBIT, % | 45.51 | 46.44 | 41.64 | 44.81 | 43.04 | 44.29 | 44.29 | 44.29 | 44.29 | 44.29 |
| Total Cash | 1,051.2 | 1,243.2 | 976.9 | 2,966.9 | 2,170.6 | 1,539.8 | 1,965.4 | 2,508.7 | 3,202.2 | 4,087.4 |
| Total Cash, percent | .0 | .0 | .0 | .0 | .0 | .0 | .0 | .0 | .0 | .0 |
| Account Receivables | 48.9 | 74.5 | 140.9 | 148.1 | 256.1 | 217.8 | 278.0 | 354.8 | 452.9 | 578.1 |
| Account Receivables, % | 10.41 | 10.89 | 15.71 | 12.47 | 21.23 | 14.14 | 14.14 | 14.14 | 14.14 | 14.14 |
| Inventories | 82.1 | 106.9 | 156.0 | 210.9 | 266.4 | 278.1 | 355.0 | 453.1 | 578.4 | 738.3 |
| Inventories, % | 17.45 | 15.62 | 17.4 | 17.76 | 22.08 | 18.06 | 18.06 | 18.06 | 18.06 | 18.06 |
| Accounts Payable | 17.8 | 24.8 | 42.1 | 40.4 | 41.3 | 58.3 | 74.4 | 95.0 | 121.3 | 154.8 |
| Accounts Payable, % | 3.79 | 3.62 | 4.7 | 3.4 | 3.42 | 3.79 | 3.79 | 3.79 | 3.79 | 3.79 |
| Capital Expenditure | -26.2 | -89.6 | -294.0 | -190.3 | -212.6 | -262.1 | -334.5 | -427.0 | -545.1 | -695.7 |
| Capital Expenditure, % | -5.58 | -13.08 | -32.79 | -16.03 | -17.63 | -17.02 | -17.02 | -17.02 | -17.02 | -17.02 |
| Tax Rate, % | 23.01 | 23.01 | 23.01 | 23.01 | 23.01 | 23.01 | 23.01 | 23.01 | 23.01 | 23.01 |
| EBITAT | 184.1 | 277.7 | 321.8 | 457.8 | 399.7 | 576.4 | 735.7 | 939.1 | 1,198.7 | 1,530.0 |
| Depreciation | ||||||||||
| Changes in Account Receivables | ||||||||||
| Changes in Inventories | ||||||||||
| Changes in Accounts Payable | ||||||||||
| Capital Expenditure | ||||||||||
| UFCF | 58.6 | 160.1 | -47.5 | 227.7 | 58.8 | 396.8 | 329.8 | 421.0 | 537.4 | 685.9 |
| WACC, % | 5.21 | 5.21 | 5.21 | 5.21 | 5.2 | 5.21 | 5.21 | 5.21 | 5.21 | 5.21 |
| PV UFCF | ||||||||||
| SUM PV UFCF | 2,007.6 | |||||||||
| Long Term Growth Rate, % | 3.50 | |||||||||
| Free cash flow (T + 1) | 710 | |||||||||
| Terminal Value | 41,629 | |||||||||
| Present Terminal Value | 32,300 | |||||||||
| Enterprise Value | 34,308 | |||||||||
| Net Debt | -2,143 | |||||||||
| Equity Value | 36,451 | |||||||||
| Diluted Shares Outstanding, MM | 123 | |||||||||
| Equity Value Per Share | 295.47 |
What You Will Receive
- Customizable Excel Template: A fully adjustable Excel-based DCF Calculator featuring pre-filled real financial data for Shanghai MicroPort Endovascular MedTech Co., Ltd. (688016SS).
- Comprehensive Data: Access to historical performance and forward-looking projections (illustrated in the highlighted cells).
- Adjustable Forecasts: Modify key assumptions such as revenue growth, EBITDA margins, and WACC.
- Instant Calculations: Quickly observe how your inputs affect the valuation of Shanghai MicroPort Endovascular MedTech Co., Ltd. (688016SS).
- Professional Resource: Designed for investors, CFOs, consultants, and financial analysts.
- User-Friendly Interface: Organized for easy navigation and understanding, accompanied by step-by-step guides.
Key Features
- Customizable Financial Inputs: Adjust essential parameters such as revenue growth, EBITDA margin, and capital expenditures tailored for Shanghai MicroPort Endovascular MedTech Co., Ltd. (688016SS).
- Instant DCF Valuation: Quickly calculates intrinsic value, NPV, and other key metrics relevant to 688016SS.
- High-Precision Accuracy: Utilizes Shanghai MicroPort's actual financial data for credible valuation results.
- Simplified Scenario Analysis: Effortlessly explore various assumptions and assess different outcomes for 688016SS.
- Efficiency Booster: Avoid the complexity of constructing detailed valuation models from the ground up.
How It Functions
- 1. Access the Template: Download and open the Excel file containing MicroPort’s preloaded data.
- 2. Modify Assumptions: Adjust key variables such as growth rates, WACC, and capital expenditures.
- 3. Discover Results Instantly: The DCF model automatically computes intrinsic value and NPV.
- 4. Explore Scenarios: Evaluate multiple forecasts to assess various valuation outcomes.
- 5. Utilize with Assurance: Present professional valuation insights to reinforce your decision-making.
Why Opt for This Calculator?
- Designed for Experts: A sophisticated tool utilized by analysts, CFOs, and industry consultants.
- Accurate Data: Historical and projected financial figures for Shanghai MicroPort Endovascular MedTech Co., Ltd. (688016SS) preloaded for precision.
- Flexible Scenario Analysis: Effortlessly test various forecasts and assumptions.
- Concise Results: Instantly computes intrinsic value, NPV, and essential financial metrics.
- User-Friendly: Step-by-step guidance simplifies the entire process.
Who Can Benefit from This Product?
- Healthcare Professionals: Enhance your understanding of endovascular techniques and apply them in clinical settings.
- Researchers: Integrate advanced medical technologies into your studies and publications.
- Investors: Validate your investment hypotheses and evaluate market trends for Shanghai MicroPort Endovascular MedTech Co., Ltd. (688016SS).
- Medical Analysts: Optimize your analysis process with a comprehensive, customizable financial model.
- Entrepreneurs in MedTech: Learn how established companies like Shanghai MicroPort are assessed in the industry.
Contents of the Template
- Preloaded MicroPort Data: Historical and projected financial information, including revenue, EBIT, and capital expenditures.
- DCF and WACC Models: Advanced spreadsheets for determining intrinsic value and Weighted Average Cost of Capital.
- Editable Inputs: Yellow-highlighted fields for modifying revenue growth, tax rates, and discount rates.
- Financial Statements: Detailed annual and quarterly financial reports for in-depth analysis.
- Key Ratios: Ratios related to profitability, leverage, and efficiency to assess performance.
- Dashboard and Charts: Visual representations of valuation results and underlying assumptions.
Disclaimer
All information, articles, and product details provided on this website are for general informational and educational purposes only. We do not claim any ownership over, nor do we intend to infringe upon, any trademarks, copyrights, logos, brand names, or other intellectual property mentioned or depicted on this site. Such intellectual property remains the property of its respective owners, and any references here are made solely for identification or informational purposes, without implying any affiliation, endorsement, or partnership.
We make no representations or warranties, express or implied, regarding the accuracy, completeness, or suitability of any content or products presented. Nothing on this website should be construed as legal, tax, investment, financial, medical, or other professional advice. In addition, no part of this site—including articles or product references—constitutes a solicitation, recommendation, endorsement, advertisement, or offer to buy or sell any securities, franchises, or other financial instruments, particularly in jurisdictions where such activity would be unlawful.
All content is of a general nature and may not address the specific circumstances of any individual or entity. It is not a substitute for professional advice or services. Any actions you take based on the information provided here are strictly at your own risk. You accept full responsibility for any decisions or outcomes arising from your use of this website and agree to release us from any liability in connection with your use of, or reliance upon, the content or products found herein.