
|
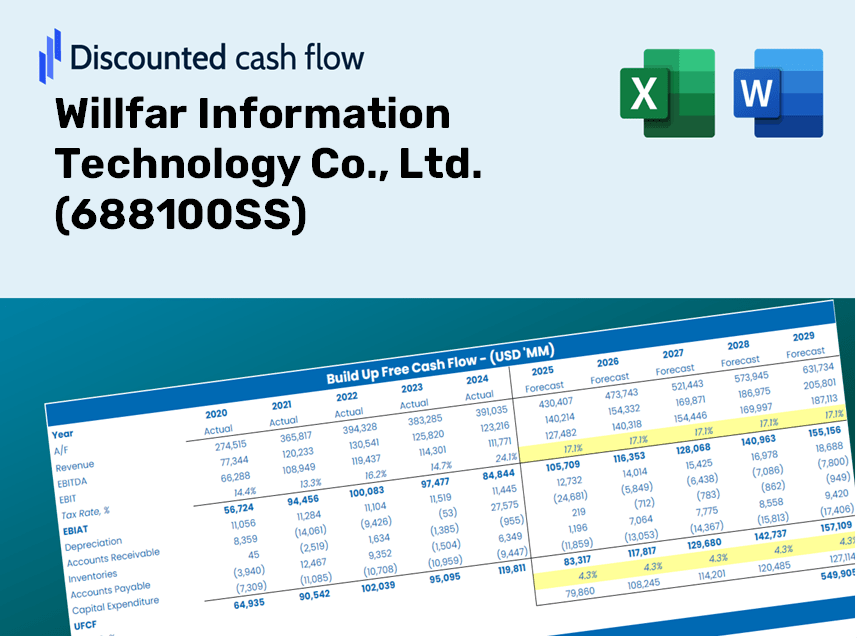
Willfar Information Technology Co., Ltd. (688100.SS) DCF Valuation |
Fully Editable: Tailor To Your Needs In Excel Or Sheets
Professional Design: Trusted, Industry-Standard Templates
Investor-Approved Valuation Models
MAC/PC Compatible, Fully Unlocked
No Expertise Is Needed; Easy To Follow
Willfar Information Technology Co., Ltd. (688100.SS) Bundle
Simplify Willfar Information Technology Co., Ltd. valuation with this customizable DCF Calculator! Featuring real Willfar Information Technology Co., Ltd. financials and adjustable forecast inputs, you can test scenarios and uncover Willfar Information Technology Co., Ltd. fair value in minutes.
Discounted Cash Flow (DCF) - (USD MM)
| Year | AY1 2020 |
AY2 2021 |
AY3 2022 |
AY4 2023 |
AY5 2024 |
FY1 2025 |
FY2 2026 |
FY3 2027 |
FY4 2028 |
FY5 2029 |
|---|---|---|---|---|---|---|---|---|---|---|
| Revenue | 1,448.6 | 1,825.6 | 2,003.6 | 2,225.2 | 2,744.8 | 3,226.4 | 3,792.5 | 4,457.9 | 5,240.1 | 6,159.6 |
| Revenue Growth, % | 0 | 26.03 | 9.75 | 11.06 | 23.35 | 17.55 | 17.55 | 17.55 | 17.55 | 17.55 |
| EBITDA | 294.1 | 352.9 | 424.0 | 550.9 | 658.8 | 706.9 | 831.0 | 976.8 | 1,148.2 | 1,349.6 |
| EBITDA, % | 20.3 | 19.33 | 21.16 | 24.76 | 24 | 21.91 | 21.91 | 21.91 | 21.91 | 21.91 |
| Depreciation | 14.4 | 17.0 | 20.3 | 23.4 | 25.6 | 31.8 | 37.3 | 43.9 | 51.6 | 60.7 |
| Depreciation, % | 0.99426 | 0.92882 | 1.01 | 1.05 | 0.93418 | 0.98464 | 0.98464 | 0.98464 | 0.98464 | 0.98464 |
| EBIT | 279.7 | 335.9 | 403.7 | 527.5 | 633.2 | 675.2 | 793.6 | 932.9 | 1,096.6 | 1,289.0 |
| EBIT, % | 19.31 | 18.4 | 20.15 | 23.71 | 23.07 | 20.93 | 20.93 | 20.93 | 20.93 | 20.93 |
| Total Cash | 1,544.0 | 1,713.1 | 1,600.3 | 1,749.3 | 1,878.0 | 2,714.9 | 3,191.3 | 3,751.3 | 4,409.5 | 5,183.2 |
| Total Cash, percent | .0 | .0 | .0 | .0 | .0 | .0 | .0 | .0 | .0 | .0 |
| Account Receivables | 913.7 | 1,122.9 | 1,383.0 | 1,652.6 | 1,987.4 | 2,195.7 | 2,581.0 | 3,033.9 | 3,566.2 | 4,192.0 |
| Account Receivables, % | 63.08 | 61.51 | 69.02 | 74.26 | 72.41 | 68.06 | 68.06 | 68.06 | 68.06 | 68.06 |
| Inventories | 124.2 | 237.2 | 262.9 | 309.6 | 342.0 | 394.0 | 463.1 | 544.4 | 639.9 | 752.2 |
| Inventories, % | 8.57 | 12.99 | 13.12 | 13.91 | 12.46 | 12.21 | 12.21 | 12.21 | 12.21 | 12.21 |
| Accounts Payable | 810.4 | 904.5 | 927.7 | 1,034.5 | 734.3 | 1,452.0 | 1,706.8 | 2,006.3 | 2,358.3 | 2,772.2 |
| Accounts Payable, % | 55.94 | 49.54 | 46.3 | 46.49 | 26.75 | 45.01 | 45.01 | 45.01 | 45.01 | 45.01 |
| Capital Expenditure | -37.5 | -37.8 | -38.2 | -21.5 | -89.8 | -69.8 | -82.0 | -96.4 | -113.3 | -133.2 |
| Capital Expenditure, % | -2.59 | -2.07 | -1.91 | -0.96801 | -3.27 | -2.16 | -2.16 | -2.16 | -2.16 | -2.16 |
| Tax Rate, % | 13.03 | 13.03 | 13.03 | 13.03 | 13.03 | 13.03 | 13.03 | 13.03 | 13.03 | 13.03 |
| EBITAT | 237.1 | 290.1 | 353.0 | 460.3 | 550.7 | 584.4 | 687.0 | 807.5 | 949.2 | 1,115.7 |
| Depreciation | ||||||||||
| Changes in Account Receivables | ||||||||||
| Changes in Inventories | ||||||||||
| Changes in Accounts Payable | ||||||||||
| Capital Expenditure | ||||||||||
| UFCF | -13.6 | 41.2 | 72.4 | 252.7 | -180.9 | 1,003.8 | 442.7 | 520.3 | 611.6 | 719.0 |
| WACC, % | 5.11 | 5.11 | 5.11 | 5.11 | 5.11 | 5.11 | 5.11 | 5.11 | 5.11 | 5.11 |
| PV UFCF | ||||||||||
| SUM PV UFCF | 2,864.9 | |||||||||
| Long Term Growth Rate, % | 3.50 | |||||||||
| Free cash flow (T + 1) | 744 | |||||||||
| Terminal Value | 46,101 | |||||||||
| Present Terminal Value | 35,926 | |||||||||
| Enterprise Value | 38,790 | |||||||||
| Net Debt | -1,824 | |||||||||
| Equity Value | 40,614 | |||||||||
| Diluted Shares Outstanding, MM | 483 | |||||||||
| Equity Value Per Share | 84.02 |
What You Will Gain
- Authentic Willfar Data: Preloaded financial insights – encompassing revenue to EBIT – derived from actual and projected metrics.
- Comprehensive Customization: Modify all essential parameters (yellow cells) such as WACC, growth %, and tax rates as per your needs.
- Instant Valuation Adjustments: Automatic recalculations to assess the impact of changes on Willfar's fair value.
- Flexible Excel Template: Designed for easy edits, scenario testing, and thorough projections.
- Efficient and Precise: Eliminate the need to construct models from scratch while ensuring accuracy and adaptability.
Key Features
- 🔍 Real-Life Willfar Financials: Pre-filled historical and projected financial data for Willfar Information Technology Co., Ltd. (688100SS).
- ✏️ Fully Customizable Inputs: Modify all essential parameters (yellow cells) such as WACC, growth %, and tax rates according to your analysis.
- 📊 Professional DCF Valuation: Integrated formulas compute the intrinsic value of Willfar using the Discounted Cash Flow method.
- ⚡ Instant Results: Immediately visualize Willfar's valuation after implementing any adjustments.
- Scenario Analysis: Evaluate and contrast different financial assumptions side-by-side for comprehensive insights.
How It Operates
- Step 1: Download the Excel file.
- Step 2: Examine Willfar Information Technology Co., Ltd.'s pre-filled financial data and projections.
- Step 3: Adjust key inputs such as revenue growth, WACC, and tax rates (highlighted cells).
- Step 4: Observe the DCF model update in real time as you modify your assumptions.
- Step 5: Review the outputs and leverage the results for your investment strategies.
Why Choose Willfar's Calculator?
- Precision: Utilizes authentic Willfar financial data for utmost accuracy.
- Versatility: Built to allow users to experiment and adjust inputs without restrictions.
- Efficiency: Eliminate the need to construct a DCF model from the ground up.
- Professional Quality: Engineered with the precision and usability expected by CFOs.
- User-Friendly: Intuitive interface suitable for users with varying levels of financial expertise.
Who Can Benefit from This Product?
- Investors: Accurately assess the fair value of Willfar Information Technology Co., Ltd. (688100SS) prior to making investment choices.
- CFOs: Utilize a professional-grade DCF model for comprehensive financial analysis and reporting.
- Consultants: Effortlessly customize the template for client valuation reports.
- Entrepreneurs: Discover financial modeling techniques employed by industry leaders.
- Educators: Implement it as a teaching resource to illustrate valuation strategies.
Contents of the Template
- Historical Data: Contains Willfar Information Technology Co., Ltd.'s past financial records and baseline forecasts.
- DCF and Levered DCF Models: Comprehensive templates for calculating the intrinsic value of Willfar Information Technology Co., Ltd. (688100SS).
- WACC Sheet: Predefined calculations for the Weighted Average Cost of Capital.
- Editable Inputs: Adjust key drivers such as growth rates, EBITDA percentages, and CAPEX projections.
- Quarterly and Annual Statements: An extensive overview of Willfar Information Technology Co., Ltd.'s financials.
- Interactive Dashboard: Dynamic visualization of valuation outcomes and forecasts.
Disclaimer
All information, articles, and product details provided on this website are for general informational and educational purposes only. We do not claim any ownership over, nor do we intend to infringe upon, any trademarks, copyrights, logos, brand names, or other intellectual property mentioned or depicted on this site. Such intellectual property remains the property of its respective owners, and any references here are made solely for identification or informational purposes, without implying any affiliation, endorsement, or partnership.
We make no representations or warranties, express or implied, regarding the accuracy, completeness, or suitability of any content or products presented. Nothing on this website should be construed as legal, tax, investment, financial, medical, or other professional advice. In addition, no part of this site—including articles or product references—constitutes a solicitation, recommendation, endorsement, advertisement, or offer to buy or sell any securities, franchises, or other financial instruments, particularly in jurisdictions where such activity would be unlawful.
All content is of a general nature and may not address the specific circumstances of any individual or entity. It is not a substitute for professional advice or services. Any actions you take based on the information provided here are strictly at your own risk. You accept full responsibility for any decisions or outcomes arising from your use of this website and agree to release us from any liability in connection with your use of, or reliance upon, the content or products found herein.