
|
Shenzhen Qingyi Photomask Limited (688138.SS) DCF Valuation |
Fully Editable: Tailor To Your Needs In Excel Or Sheets
Professional Design: Trusted, Industry-Standard Templates
Investor-Approved Valuation Models
MAC/PC Compatible, Fully Unlocked
No Expertise Is Needed; Easy To Follow
Shenzhen Qingyi Photomask Limited (688138.SS) Bundle
Discover the true value of Shenzhen Qingyi Photomask Limited (688138SS) using our advanced DCF Calculator! Adjust key assumptions, explore various scenarios, and evaluate how changes affect the valuation of Shenzhen Qingyi Photomask Limited (688138SS) – all within a single Excel template.
Discounted Cash Flow (DCF) - (USD MM)
| Year | AY1 2020 |
AY2 2021 |
AY3 2022 |
AY4 2023 |
AY5 2024 |
FY1 2025 |
FY2 2026 |
FY3 2027 |
FY4 2028 |
FY5 2029 |
|---|---|---|---|---|---|---|---|---|---|---|
| Revenue | 487.2 | 543.9 | 762.2 | 924.2 | 1,112.2 | 1,371.9 | 1,692.1 | 2,087.2 | 2,574.4 | 3,175.3 |
| Revenue Growth, % | 0 | 11.64 | 40.12 | 21.26 | 20.35 | 23.34 | 23.34 | 23.34 | 23.34 | 23.34 |
| EBITDA | 117.6 | 116.7 | 196.0 | 251.7 | 317.4 | 348.7 | 430.1 | 530.6 | 654.4 | 807.2 |
| EBITDA, % | 24.14 | 21.46 | 25.72 | 27.24 | 28.54 | 25.42 | 25.42 | 25.42 | 25.42 | 25.42 |
| Depreciation | 39.9 | 74.2 | 110.1 | 118.2 | 128.5 | 166.3 | 205.2 | 253.1 | 312.1 | 385.0 |
| Depreciation, % | 8.19 | 13.64 | 14.45 | 12.79 | 11.56 | 12.13 | 12.13 | 12.13 | 12.13 | 12.13 |
| EBIT | 77.7 | 42.5 | 85.9 | 133.5 | 188.9 | 182.4 | 225.0 | 277.5 | 342.3 | 422.1 |
| EBIT, % | 15.95 | 7.82 | 11.27 | 14.45 | 16.98 | 13.29 | 13.29 | 13.29 | 13.29 | 13.29 |
| Total Cash | 218.1 | 154.9 | 224.1 | 342.9 | 354.8 | 471.0 | 580.9 | 716.5 | 883.8 | 1,090.1 |
| Total Cash, percent | .0 | .0 | .0 | .0 | .0 | .0 | .0 | .0 | .0 | .0 |
| Account Receivables | 111.4 | 172.1 | 233.9 | 315.8 | 346.3 | 413.0 | 509.4 | 628.3 | 774.9 | 955.8 |
| Account Receivables, % | 22.87 | 31.64 | 30.7 | 34.17 | 31.14 | 30.1 | 30.1 | 30.1 | 30.1 | 30.1 |
| Inventories | 60.4 | 87.4 | 143.4 | 170.0 | 200.8 | 229.7 | 283.4 | 349.5 | 431.1 | 531.7 |
| Inventories, % | 12.4 | 16.06 | 18.82 | 18.4 | 18.05 | 16.75 | 16.75 | 16.75 | 16.75 | 16.75 |
| Accounts Payable | 122.5 | 91.3 | 162.4 | 156.4 | 228.0 | 276.2 | 340.7 | 420.2 | 518.3 | 639.3 |
| Accounts Payable, % | 25.15 | 16.79 | 21.31 | 16.92 | 20.5 | 20.13 | 20.13 | 20.13 | 20.13 | 20.13 |
| Capital Expenditure | -256.4 | -305.0 | -98.0 | -242.8 | -662.5 | -569.0 | -701.9 | -865.7 | -1,067.8 | -1,317.1 |
| Capital Expenditure, % | -52.63 | -56.08 | -12.86 | -26.27 | -59.56 | -41.48 | -41.48 | -41.48 | -41.48 | -41.48 |
| Tax Rate, % | 10.72 | 10.72 | 10.72 | 10.72 | 10.72 | 10.72 | 10.72 | 10.72 | 10.72 | 10.72 |
| EBITAT | 65.5 | 35.4 | 84.7 | 118.6 | 168.7 | 162.0 | 199.8 | 246.5 | 304.0 | 375.0 |
| Depreciation | ||||||||||
| Changes in Account Receivables | ||||||||||
| Changes in Inventories | ||||||||||
| Changes in Accounts Payable | ||||||||||
| Capital Expenditure | ||||||||||
| UFCF | -200.3 | -314.2 | 50.0 | -120.4 | -355.1 | -288.0 | -382.4 | -471.7 | -581.8 | -717.6 |
| WACC, % | 4.56 | 4.56 | 4.6 | 4.58 | 4.58 | 4.58 | 4.58 | 4.58 | 4.58 | 4.58 |
| PV UFCF | ||||||||||
| SUM PV UFCF | -2,097.8 | |||||||||
| Long Term Growth Rate, % | 4.00 | |||||||||
| Free cash flow (T + 1) | -746 | |||||||||
| Terminal Value | -129,649 | |||||||||
| Present Terminal Value | -103,661 | |||||||||
| Enterprise Value | -105,759 | |||||||||
| Net Debt | 282 | |||||||||
| Equity Value | -106,041 | |||||||||
| Diluted Shares Outstanding, MM | 265 | |||||||||
| Equity Value Per Share | -400.71 |
Benefits You Will Receive
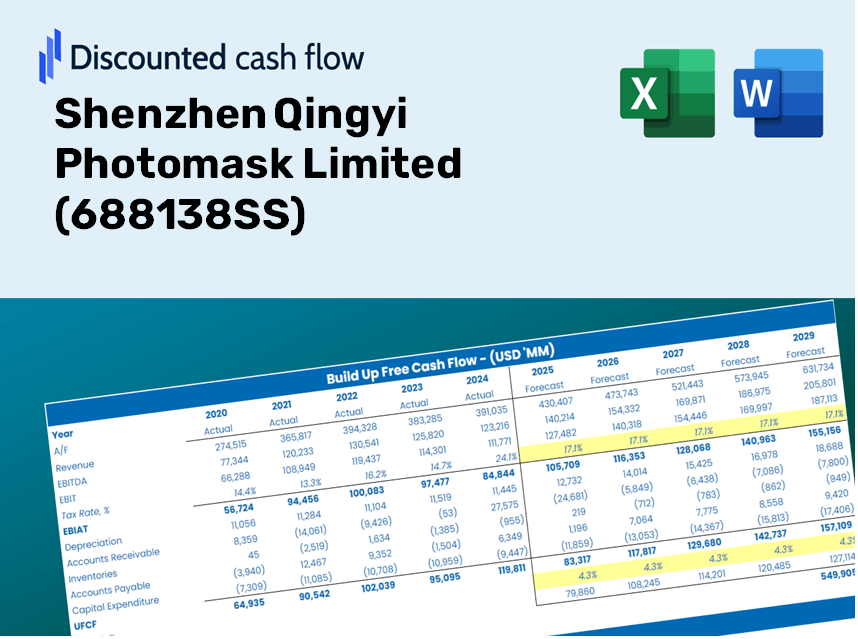
- Authentic Shenzhen Qingyi Data: Comprehensive financials – encompassing revenue and EBIT – derived from both actual and projected figures.
- Complete Customization: Modify all essential parameters (yellow cells) such as WACC, growth %, and tax rates to suit your analysis.
- Immediate Valuation Updates: Automated recalibrations to evaluate the effects of adjustments on Shenzhen Qingyi's fair value.
- Flexible Excel Template: Designed for swift modifications, scenario analysis, and comprehensive projections.
- Efficient and Precise: Eliminate the need to create models from the ground up while ensuring accuracy and adaptability.
Key Features
- Customizable Forecast Inputs: Adjust essential metrics such as revenue growth, EBITDA %, and capital expenditures.
- Instant DCF Valuation: Automatically computes intrinsic value, NPV, and additional financial metrics in real-time.
- High-Precision Accuracy: Leverages Shenzhen Qingyi Photomask Limited’s actual financial data for credible valuation results.
- Simplified Scenario Analysis: Effortlessly evaluate various assumptions and analyze differing outcomes.
- Efficiency Booster: Remove the necessity of constructing complex valuation models from the ground up.
How It Works
- Step 1: Download the Excel file for Shenzhen Qingyi Photomask Limited (688138SS).
- Step 2: Examine the pre-filled financial data and forecasts specific to Shenzhen Qingyi Photomask Limited (688138SS).
- Step 3: Adjust key inputs such as revenue growth, WACC, and tax rates (highlighted cells) to fit your analysis.
- Step 4: Observe how the DCF model updates in real-time as you modify your assumptions.
- Step 5: Review the outputs and leverage the results to inform your investment strategies.
Why Opt for This Calculator?
- Precise Information: Utilizes authentic Shenzhen Qingyi Photomask Limited financials for trustworthy valuation outcomes.
- Tailorable: Modify essential metrics such as growth rates, WACC, and tax rates to fit your forecasts.
- Efficiency Boost: Includes pre-configured calculations to save you from building models from the ground up.
- Expert-Quality Tool: Crafted specifically for investors, analysts, and consultants.
- Easy to Navigate: Features a straightforward interface and clear instructions, suitable for all users.
Who Can Benefit from This Product?
- Investors: Evaluate the valuation of Shenzhen Qingyi Photomask Limited (688138SS) before making investment decisions.
- CFOs and Financial Analysts: Enhance the efficiency of valuation processes and assess financial forecasts.
- Startup Founders: Gain insights into how established companies like Shenzhen Qingyi Photomask Limited (688138SS) are appraised.
- Consultants: Create comprehensive valuation reports for clients in the industry.
- Students and Educators: Utilize real data from Shenzhen Qingyi Photomask Limited (688138SS) to learn and teach valuation methodologies.
Contents of the Template
- Detailed DCF Model: An editable template featuring comprehensive valuation computations.
- Historical and Projected Data: Shenzhen Qingyi Photomask Limited’s (688138SS) financial history and forecasts included for thorough analysis.
- Adjustable Variables: Modify WACC, growth rates, and taxation assumptions to explore different scenarios.
- Complete Financial Statements: Yearly and quarterly financial breakdowns for enhanced understanding.
- Essential Ratios: Integrated analysis focusing on profitability, operational efficiency, and financial leverage.
- Visual Dashboard: Graphs and tables offering clear, actionable insights.
Disclaimer
All information, articles, and product details provided on this website are for general informational and educational purposes only. We do not claim any ownership over, nor do we intend to infringe upon, any trademarks, copyrights, logos, brand names, or other intellectual property mentioned or depicted on this site. Such intellectual property remains the property of its respective owners, and any references here are made solely for identification or informational purposes, without implying any affiliation, endorsement, or partnership.
We make no representations or warranties, express or implied, regarding the accuracy, completeness, or suitability of any content or products presented. Nothing on this website should be construed as legal, tax, investment, financial, medical, or other professional advice. In addition, no part of this site—including articles or product references—constitutes a solicitation, recommendation, endorsement, advertisement, or offer to buy or sell any securities, franchises, or other financial instruments, particularly in jurisdictions where such activity would be unlawful.
All content is of a general nature and may not address the specific circumstances of any individual or entity. It is not a substitute for professional advice or services. Any actions you take based on the information provided here are strictly at your own risk. You accept full responsibility for any decisions or outcomes arising from your use of this website and agree to release us from any liability in connection with your use of, or reliance upon, the content or products found herein.