
|
China Galaxy Securities Co., Ltd. (6881.HK) DCF Valuation |
Fully Editable: Tailor To Your Needs In Excel Or Sheets
Professional Design: Trusted, Industry-Standard Templates
Investor-Approved Valuation Models
MAC/PC Compatible, Fully Unlocked
No Expertise Is Needed; Easy To Follow
China Galaxy Securities Co., Ltd. (6881.HK) Bundle
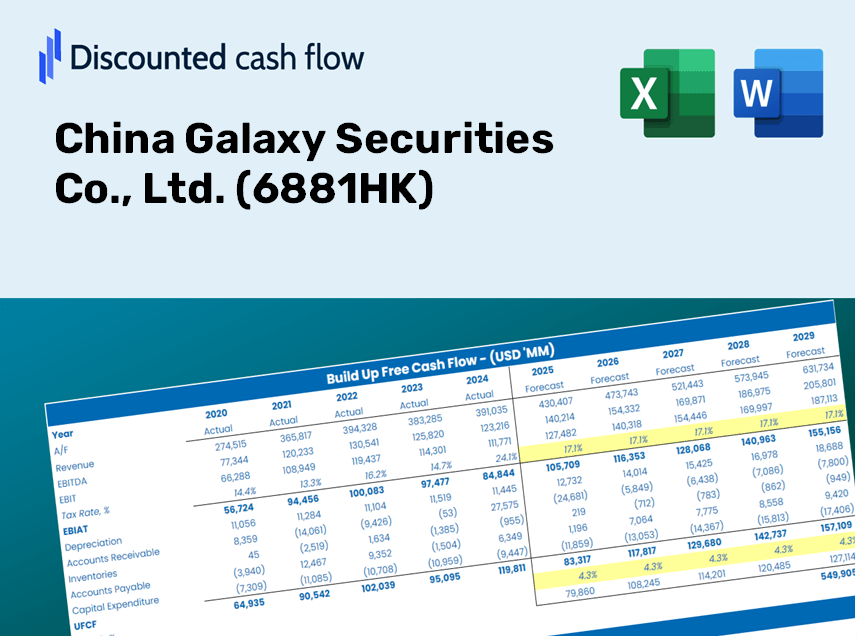
Streamline China Galaxy Securities Co., Ltd. (6881HK) valuation with this customizable DCF Calculator! With real China Galaxy Securities Co., Ltd. (6881HK) financials and adjustable forecast inputs, you can explore various scenarios and discover China Galaxy Securities Co., Ltd. (6881HK) fair value in just minutes.
Discounted Cash Flow (DCF) - (USD MM)
| Year | AY1 2020 |
AY2 2021 |
AY3 2022 |
AY4 2023 |
AY5 2024 |
FY1 2025 |
FY2 2026 |
FY3 2027 |
FY4 2028 |
FY5 2029 |
|---|---|---|---|---|---|---|---|---|---|---|
| Revenue | 18,823.0 | 25,095.6 | 30,116.1 | 37,907.4 | 24,782.3 | 27,544.0 | 30,613.6 | 34,025.2 | 37,816.9 | 42,031.3 |
| Revenue Growth, % | 0 | 33.32 | 20.01 | 25.87 | -34.62 | 11.14 | 11.14 | 11.14 | 11.14 | 11.14 |
| EBITDA | 10,921.0 | 14,919.3 | 9,796.5 | .0 | .0 | 8,263.1 | 9,184.0 | 10,207.5 | 11,345.0 | 12,609.3 |
| EBITDA, % | 58.02 | 59.45 | 32.53 | 0 | 0 | 30 | 30 | 30 | 30 | 30 |
| Depreciation | 888.4 | 904.9 | 1,063.2 | 1,204.1 | 1,273.1 | 1,111.1 | 1,234.9 | 1,372.6 | 1,525.5 | 1,695.5 |
| Depreciation, % | 4.72 | 3.61 | 3.53 | 3.18 | 5.14 | 4.03 | 4.03 | 4.03 | 4.03 | 4.03 |
| EBIT | 10,032.6 | 14,014.5 | 8,733.3 | -1,204.1 | -1,273.1 | 7,152.0 | 7,949.0 | 8,834.9 | 9,819.5 | 10,913.7 |
| EBIT, % | 53.3 | 55.84 | 29 | -3.18 | -5.14 | 25.97 | 25.97 | 25.97 | 25.97 | 25.97 |
| Total Cash | 120,012.2 | 142,324.9 | 192,951.0 | 182,543.7 | 250,682.9 | 27,544.0 | 30,613.6 | 34,025.2 | 37,816.9 | 42,031.3 |
| Total Cash, percent | .0 | .0 | .0 | .0 | .0 | .0 | .0 | .0 | .0 | .0 |
| Account Receivables | 14,433.6 | 12,833.2 | 16,006.5 | 19,811.2 | 19,464.9 | 17,175.0 | 19,089.0 | 21,216.2 | 23,580.6 | 26,208.4 |
| Account Receivables, % | 76.68 | 51.14 | 53.15 | 52.26 | 78.54 | 62.35 | 62.35 | 62.35 | 62.35 | 62.35 |
| Inventories | .0 | .0 | .0 | .0 | .0 | .0 | .0 | .0 | .0 | .0 |
| Inventories, % | 0 | 0 | 0 | 0 | 0 | 0 | 0 | 0 | 0 | 0 |
| Accounts Payable | 107,013.2 | 140,682.4 | 142,046.6 | 131,764.9 | 181,425.6 | 27,544.0 | 30,613.6 | 34,025.2 | 37,816.9 | 42,031.3 |
| Accounts Payable, % | 568.52 | 560.59 | 471.66 | 347.6 | 732.08 | 100 | 100 | 100 | 100 | 100 |
| Capital Expenditure | -463.8 | -656.4 | -1,267.9 | -761.7 | -844.4 | -810.1 | -900.4 | -1,000.7 | -1,112.2 | -1,236.2 |
| Capital Expenditure, % | -2.46 | -2.62 | -4.21 | -2.01 | -3.41 | -2.94 | -2.94 | -2.94 | -2.94 | -2.94 |
| Tax Rate, % | 4.64 | 4.64 | 4.64 | 4.64 | 4.64 | 4.64 | 4.64 | 4.64 | 4.64 | 4.64 |
| EBITAT | 7,936.5 | 11,427.9 | 8,510.5 | -1,166.4 | -1,214.1 | 6,441.5 | 7,159.4 | 7,957.2 | 8,844.0 | 9,829.6 |
| Depreciation | ||||||||||
| Changes in Account Receivables | ||||||||||
| Changes in Inventories | ||||||||||
| Changes in Accounts Payable | ||||||||||
| Capital Expenditure | ||||||||||
| UFCF | 100,940.7 | 46,946.0 | 6,496.8 | -14,810.3 | 49,221.7 | -144,849.1 | 8,649.5 | 9,613.4 | 10,684.7 | 11,875.4 |
| WACC, % | 5.42 | 5.51 | 6.11 | 6.09 | 6.03 | 5.83 | 5.83 | 5.83 | 5.83 | 5.83 |
| PV UFCF | ||||||||||
| SUM PV UFCF | -103,572.6 | |||||||||
| Long Term Growth Rate, % | 2.00 | |||||||||
| Free cash flow (T + 1) | 12,113 | |||||||||
| Terminal Value | 316,067 | |||||||||
| Present Terminal Value | 238,060 | |||||||||
| Enterprise Value | 134,487 | |||||||||
| Net Debt | -48,106 | |||||||||
| Equity Value | 182,593 | |||||||||
| Diluted Shares Outstanding, MM | 10,934 | |||||||||
| Equity Value Per Share | 16.70 |
What You Will Receive
- Adjustable Forecast Parameters: Effortlessly modify assumptions (growth %, margins, WACC) to explore various scenarios.
- Up-to-Date Financial Data: China Galaxy Securities Co., Ltd.'s financial information pre-loaded to kickstart your analysis.
- Automated DCF Calculations: The template automatically computes Net Present Value (NPV) and intrinsic value for your convenience.
- Tailored and Professional Design: A sleek Excel model that flexibly meets your valuation requirements.
- Designed for Analysts and Investors: Perfect for evaluating projections, confirming strategies, and enhancing efficiency.
Key Features
- Customizable Forecast Inputs: Adjust essential parameters such as revenue growth, EBITDA %, and capital expenditures tailored for China Galaxy Securities Co., Ltd. (6881HK).
- Instant DCF Valuation: Provides real-time calculations for intrinsic value, NPV, and additional financial metrics.
- High-Precision Accuracy: Leverages China Galaxy’s actual financial data to ensure realistic valuation assessments.
- Simplified Scenario Analysis: Effortlessly evaluate various assumptions and analyze different outcomes.
- Efficiency Booster: Avoid the complexities of building detailed valuation models from the ground up.
How It Operates
- Download: Obtain the ready-made Excel file filled with financial data for China Galaxy Securities Co., Ltd. (6881HK).
- Customize: Modify forecasts, such as revenue growth, EBITDA %, and WACC to fit your analysis.
- Real-Time Updates: The intrinsic value and NPV calculations refresh automatically as you make changes.
- Scenario Testing: Develop various projections and compare their outcomes instantly.
- Informed Decisions: Leverage the valuation results to shape your investment approach.
Why Opt for China Galaxy Securities Co., Ltd. (6881HK) Calculator?
- Precision: Utilizes real financial data for high accuracy.
- Versatility: Tailored for users to easily experiment with and adjust inputs.
- Efficiency: Eliminate the complexity of constructing a DCF model from the ground up.
- Expert-Level: Crafted with the insight of top financial executives for optimal functionality.
- Intuitive: Streamlined interface makes it accessible for all users, regardless of financial modeling expertise.
Who Can Benefit from This Product?
- Investors: Evaluate the valuation of China Galaxy Securities Co., Ltd. (6881HK) before making trading decisions.
- CFOs and Financial Analysts: Optimize valuation methodologies and validate financial forecasts.
- Startup Founders: Gain insights into the valuation strategies of established firms like China Galaxy Securities Co., Ltd. (6881HK).
- Consultants: Produce detailed valuation reports for your clients.
- Students and Educators: Utilize actual market data to teach and apply valuation methods.
Contents of the Template
- Preloaded 6881HK Data: Historical and forecasted financial metrics, including revenue, EBIT, and capital expenditures.
- DCF and WACC Models: Professional-grade sheets designed for calculating intrinsic value and Weighted Average Cost of Capital.
- Editable Inputs: Yellow-highlighted cells for modifying revenue growth, tax rates, and discount rates.
- Financial Statements: Detailed annual and quarterly financial statements for in-depth analysis.
- Key Ratios: Metrics for profitability, leverage, and efficiency to assess performance.
- Dashboard and Charts: Visual representations of valuation results and underlying assumptions.
Disclaimer
All information, articles, and product details provided on this website are for general informational and educational purposes only. We do not claim any ownership over, nor do we intend to infringe upon, any trademarks, copyrights, logos, brand names, or other intellectual property mentioned or depicted on this site. Such intellectual property remains the property of its respective owners, and any references here are made solely for identification or informational purposes, without implying any affiliation, endorsement, or partnership.
We make no representations or warranties, express or implied, regarding the accuracy, completeness, or suitability of any content or products presented. Nothing on this website should be construed as legal, tax, investment, financial, medical, or other professional advice. In addition, no part of this site—including articles or product references—constitutes a solicitation, recommendation, endorsement, advertisement, or offer to buy or sell any securities, franchises, or other financial instruments, particularly in jurisdictions where such activity would be unlawful.
All content is of a general nature and may not address the specific circumstances of any individual or entity. It is not a substitute for professional advice or services. Any actions you take based on the information provided here are strictly at your own risk. You accept full responsibility for any decisions or outcomes arising from your use of this website and agree to release us from any liability in connection with your use of, or reliance upon, the content or products found herein.