
|
Suzhou Oriental Semiconductor Company Limited (688261.SS) DCF Valuation |
Fully Editable: Tailor To Your Needs In Excel Or Sheets
Professional Design: Trusted, Industry-Standard Templates
Investor-Approved Valuation Models
MAC/PC Compatible, Fully Unlocked
No Expertise Is Needed; Easy To Follow
Suzhou Oriental Semiconductor Company Limited (688261.SS) Bundle
Gain insights into your Suzhou Oriental Semiconductor Company Limited (688261SS) valuation analysis with our state-of-the-art DCF Calculator! This Excel template comes preloaded with real data for (688261SS), enabling you to adjust forecasts and assumptions to accurately determine the intrinsic value of Suzhou Oriental Semiconductor Company Limited.
Discounted Cash Flow (DCF) - (USD MM)
| Year | AY1 2020 |
AY2 2021 |
AY3 2022 |
AY4 2023 |
AY5 2024 |
FY1 2025 |
FY2 2026 |
FY3 2027 |
FY4 2028 |
FY5 2029 |
|---|---|---|---|---|---|---|---|---|---|---|
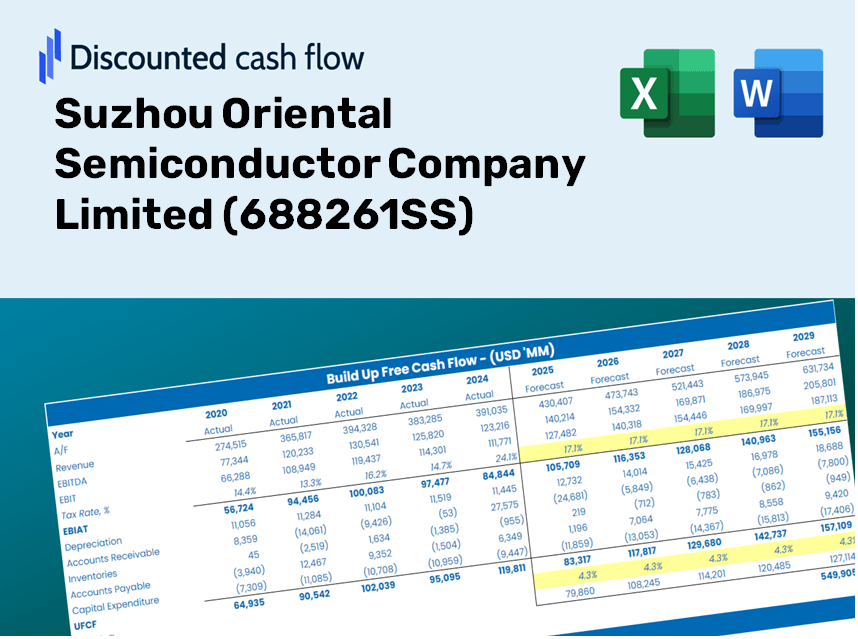
| Revenue | 308.8 | 782.1 | 1,116.4 | 972.9 | 1,003.2 | 1,336.8 | 1,781.3 | 2,373.6 | 3,162.9 | 4,214.6 |
| Revenue Growth, % | 0 | 153.28 | 42.74 | -12.86 | 3.12 | 33.25 | 33.25 | 33.25 | 33.25 | 33.25 |
| EBITDA | 24.7 | 156.4 | 284.1 | 103.0 | -6.1 | 169.5 | 225.9 | 301.0 | 401.2 | 534.5 |
| EBITDA, % | 7.99 | 19.99 | 25.45 | 10.58 | -0.60651 | 12.68 | 12.68 | 12.68 | 12.68 | 12.68 |
| Depreciation | .7 | 1.8 | 2.1 | 6.3 | 8.0 | 5.6 | 7.5 | 9.9 | 13.2 | 17.6 |
| Depreciation, % | 0.23451 | 0.22545 | 0.18967 | 0.6487 | 0.79366 | 0.4184 | 0.4184 | 0.4184 | 0.4184 | 0.4184 |
| EBIT | 24.0 | 154.6 | 282.0 | 96.6 | -14.0 | 164.0 | 218.5 | 291.1 | 387.9 | 516.9 |
| EBIT, % | 7.76 | 19.77 | 25.26 | 9.93 | -1.4 | 12.26 | 12.26 | 12.26 | 12.26 | 12.26 |
| Total Cash | 250.3 | 372.6 | 2,444.2 | 2,250.7 | 2,144.2 | 1,146.2 | 1,527.3 | 2,035.2 | 2,711.9 | 3,613.7 |
| Total Cash, percent | .0 | .0 | .0 | .0 | .0 | .0 | .0 | .0 | .0 | .0 |
| Account Receivables | 89.4 | 109.0 | 211.2 | 140.1 | 283.5 | 279.3 | 372.2 | 496.0 | 660.9 | 880.7 |
| Account Receivables, % | 28.96 | 13.93 | 18.92 | 14.4 | 28.26 | 20.9 | 20.9 | 20.9 | 20.9 | 20.9 |
| Inventories | 74.8 | 99.6 | 175.0 | 340.4 | 360.6 | 330.3 | 440.2 | 586.6 | 781.6 | 1,041.5 |
| Inventories, % | 24.21 | 12.74 | 15.68 | 34.98 | 35.94 | 24.71 | 24.71 | 24.71 | 24.71 | 24.71 |
| Accounts Payable | 8.2 | 42.3 | 35.2 | 92.2 | 151.0 | 95.5 | 127.3 | 169.6 | 226.1 | 301.2 |
| Accounts Payable, % | 2.65 | 5.41 | 3.15 | 9.47 | 15.05 | 7.15 | 7.15 | 7.15 | 7.15 | 7.15 |
| Capital Expenditure | -5.1 | -5.2 | -10.9 | -75.2 | -32.3 | -38.1 | -50.8 | -67.7 | -90.2 | -120.2 |
| Capital Expenditure, % | -1.67 | -0.66805 | -0.97425 | -7.73 | -3.22 | -2.85 | -2.85 | -2.85 | -2.85 | -2.85 |
| Tax Rate, % | -21.43 | -21.43 | -21.43 | -21.43 | -21.43 | -21.43 | -21.43 | -21.43 | -21.43 | -21.43 |
| EBITAT | 20.4 | 134.6 | 245.2 | 90.1 | -17.1 | 148.4 | 197.7 | 263.4 | 351.0 | 467.8 |
| Depreciation | ||||||||||
| Changes in Account Receivables | ||||||||||
| Changes in Inventories | ||||||||||
| Changes in Accounts Payable | ||||||||||
| Capital Expenditure | ||||||||||
| UFCF | -140.0 | 120.8 | 51.6 | -16.0 | -146.2 | 94.8 | -16.6 | -22.1 | -29.5 | -39.3 |
| WACC, % | 5.73 | 5.73 | 5.73 | 5.74 | 5.74 | 5.74 | 5.74 | 5.74 | 5.74 | 5.74 |
| PV UFCF | ||||||||||
| SUM PV UFCF | 2.7 | |||||||||
| Long Term Growth Rate, % | 2.00 | |||||||||
| Free cash flow (T + 1) | -40 | |||||||||
| Terminal Value | -1,073 | |||||||||
| Present Terminal Value | -812 | |||||||||
| Enterprise Value | -809 | |||||||||
| Net Debt | -2,072 | |||||||||
| Equity Value | 1,262 | |||||||||
| Diluted Shares Outstanding, MM | 122 | |||||||||
| Equity Value Per Share | 10.35 |
What You'll Receive
- Reliable Suzhou Oriental Data: Preloaded financials – encompassing revenue through EBIT – derived from actual and projected metrics.
- Comprehensive Customization: Modify all essential parameters (yellow cells) such as WACC, growth %, and tax rates to suit your analysis.
- Immediate Valuation Updates: Automatic recalculations to assess the influence of changes on the fair value of Suzhou Oriental Semiconductor Company Limited (688261SS).
- Flexible Excel Template: Designed for quick adjustments, scenario analysis, and in-depth forecasting.
- Efficient and Precise: Eliminate the need to create models from the ground up while ensuring accuracy and adaptability.
Key Features
- Customizable Forecast Inputs: Adjust essential parameters such as revenue growth, EBITDA percentage, and capital expenditures.
- Instant DCF Valuation: Quickly computes intrinsic value, net present value (NPV), and other financial metrics.
- High-Precision Accuracy: Leverages Suzhou Oriental Semiconductor’s real-world financial data for reliable valuation results.
- Simplified Scenario Analysis: Effortlessly explore various assumptions and evaluate different outcomes.
- Efficiency-Boosting Tool: Avoid the complexity of creating intricate valuation models from the ground up.
How It Works
- Step 1: Download the Excel file.
- Step 2: Examine the pre-populated data for Suzhou Oriental Semiconductor Company Limited (688261SS), including historical and projected figures.
- Step 3: Modify key assumptions (highlighted in yellow) according to your analysis.
- Step 4: Observe the automatic recalculations of intrinsic value for Suzhou Oriental Semiconductor Company Limited (688261SS).
- Step 5: Utilize the results for making investment decisions or for reporting purposes.
Why Choose the Suzhou Oriental Semiconductor Company Limited Calculator?
- Precision: Accurate financial data from Suzhou Oriental Semiconductor ensures reliable results.
- Versatility: Tailored for users to easily experiment with and adjust parameters.
- Efficiency: Eliminate the complexity of creating a DCF model from the ground up.
- High-Quality: Crafted with the precision and functionality expected at the CFO level.
- User-Friendly: Intuitive design makes it accessible for users without extensive financial modeling knowledge.
Who Should Utilize This Product?
- Finance Students: Master valuation methods and practice with actual data for Suzhou Oriental Semiconductor Company Limited (688261SS).
- Academics: Integrate industry-standard models into your teaching or scholarly pursuits related to (688261SS).
- Investors: Validate your hypotheses and evaluate the valuation implications for Suzhou Oriental Semiconductor Company Limited (688261SS).
- Analysts: Enhance your efficiency with a pre-designed, adaptable DCF model tailored for (688261SS).
- Small Business Owners: Discover how major public entities like Suzhou Oriental Semiconductor Company Limited (688261SS) are assessed and analyzed.
Contents of the Template
- Operating and Balance Sheet Data: Pre-filled historical data and forecasts for Suzhou Oriental Semiconductor Company Limited (688261SS), including revenue, EBITDA, EBIT, and capital expenditures.
- WACC Calculation: A dedicated worksheet for calculating the Weighted Average Cost of Capital (WACC), featuring key parameters such as Beta, risk-free rate, and share price.
- DCF Valuation (Unlevered and Levered): Customizable Discounted Cash Flow models that illustrate intrinsic value with comprehensive calculations.
- Financial Statements: Pre-loaded annual and quarterly financial statements to facilitate analysis.
- Key Ratios: A set of profitability, leverage, and efficiency ratios specific to Suzhou Oriental Semiconductor Company Limited (688261SS).
- Dashboard and Charts: A visual summary showcasing valuation outputs and assumptions, making it easier to analyze results.
Disclaimer
All information, articles, and product details provided on this website are for general informational and educational purposes only. We do not claim any ownership over, nor do we intend to infringe upon, any trademarks, copyrights, logos, brand names, or other intellectual property mentioned or depicted on this site. Such intellectual property remains the property of its respective owners, and any references here are made solely for identification or informational purposes, without implying any affiliation, endorsement, or partnership.
We make no representations or warranties, express or implied, regarding the accuracy, completeness, or suitability of any content or products presented. Nothing on this website should be construed as legal, tax, investment, financial, medical, or other professional advice. In addition, no part of this site—including articles or product references—constitutes a solicitation, recommendation, endorsement, advertisement, or offer to buy or sell any securities, franchises, or other financial instruments, particularly in jurisdictions where such activity would be unlawful.
All content is of a general nature and may not address the specific circumstances of any individual or entity. It is not a substitute for professional advice or services. Any actions you take based on the information provided here are strictly at your own risk. You accept full responsibility for any decisions or outcomes arising from your use of this website and agree to release us from any liability in connection with your use of, or reliance upon, the content or products found herein.