
|
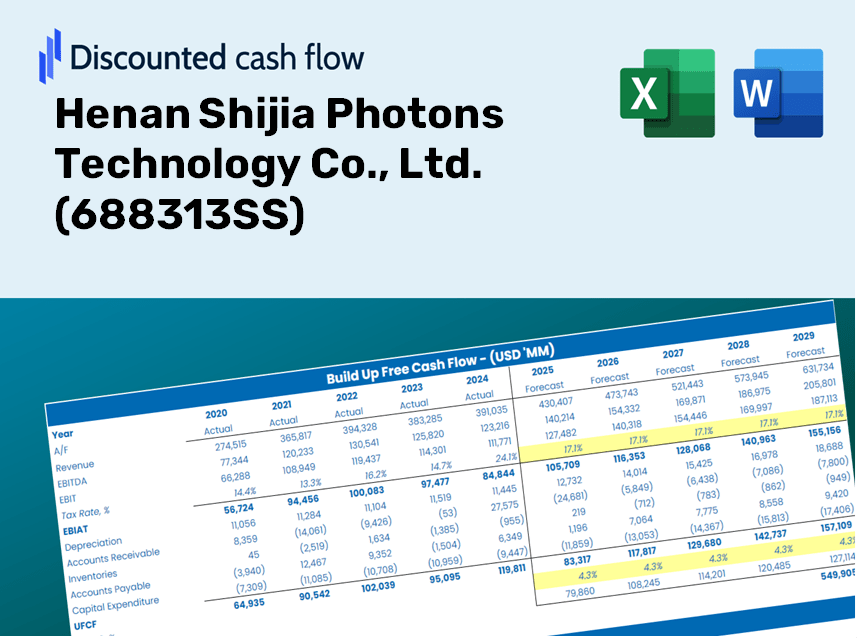
Henan Shijia Photons Technology Co., Ltd. (688313.SS) DCF Valuation |
Fully Editable: Tailor To Your Needs In Excel Or Sheets
Professional Design: Trusted, Industry-Standard Templates
Investor-Approved Valuation Models
MAC/PC Compatible, Fully Unlocked
No Expertise Is Needed; Easy To Follow
Henan Shijia Photons Technology Co., Ltd. (688313.SS) Bundle
Enhance your investment strategies with the (688313SS) DCF Calculator! Dive into authentic Henan Shijia Photons Technology Co., Ltd. financials, adjust growth projections and expenses, and immediately observe how these adjustments affect the intrinsic value of (688313SS).
Discounted Cash Flow (DCF) - (USD MM)
| Year | AY1 2020 |
AY2 2021 |
AY3 2022 |
AY4 2023 |
AY5 2024 |
FY1 2025 |
FY2 2026 |
FY3 2027 |
FY4 2028 |
FY5 2029 |
|---|---|---|---|---|---|---|---|---|---|---|
| Revenue | 671.6 | 817.3 | 903.3 | 754.6 | 1,074.5 | 1,230.7 | 1,409.7 | 1,614.6 | 1,849.3 | 2,118.2 |
| Revenue Growth, % | 0 | 21.7 | 10.51 | -16.46 | 42.4 | 14.54 | 14.54 | 14.54 | 14.54 | 14.54 |
| EBITDA | 62.4 | 77.7 | 82.9 | -14.7 | 106.8 | 88.5 | 101.4 | 116.1 | 133.0 | 152.3 |
| EBITDA, % | 9.29 | 9.5 | 9.18 | -1.95 | 9.94 | 7.19 | 7.19 | 7.19 | 7.19 | 7.19 |
| Depreciation | 45.9 | 52.4 | 58.8 | 63.4 | 67.8 | 84.9 | 97.2 | 111.3 | 127.5 | 146.1 |
| Depreciation, % | 6.84 | 6.42 | 6.51 | 8.4 | 6.31 | 6.9 | 6.9 | 6.9 | 6.9 | 6.9 |
| EBIT | 16.5 | 25.2 | 24.1 | -78.1 | 38.9 | 3.6 | 4.2 | 4.8 | 5.5 | 6.3 |
| EBIT, % | 2.46 | 3.09 | 2.67 | -10.35 | 3.62 | 0.29618 | 0.29618 | 0.29618 | 0.29618 | 0.29618 |
| Total Cash | 568.4 | 485.6 | 429.8 | 432.0 | 332.1 | 688.7 | 788.8 | 903.5 | 1,034.8 | 1,185.2 |
| Total Cash, percent | .0 | .0 | .0 | .0 | .0 | .0 | .0 | .0 | .0 | .0 |
| Account Receivables | 272.3 | 350.1 | 367.0 | 348.3 | 468.6 | 526.2 | 602.7 | 690.3 | 790.7 | 905.7 |
| Account Receivables, % | 40.55 | 42.83 | 40.63 | 46.16 | 43.61 | 42.76 | 42.76 | 42.76 | 42.76 | 42.76 |
| Inventories | 154.8 | 188.9 | 195.3 | 147.5 | 323.9 | 289.2 | 331.2 | 379.4 | 434.5 | 497.7 |
| Inventories, % | 23.06 | 23.11 | 21.62 | 19.54 | 30.14 | 23.5 | 23.5 | 23.5 | 23.5 | 23.5 |
| Accounts Payable | 126.5 | 148.3 | 138.2 | 122.5 | 349.6 | 248.7 | 284.9 | 326.3 | 373.7 | 428.1 |
| Accounts Payable, % | 18.84 | 18.14 | 15.3 | 16.24 | 32.53 | 20.21 | 20.21 | 20.21 | 20.21 | 20.21 |
| Capital Expenditure | -80.5 | -110.7 | -102.4 | -50.0 | -125.9 | -135.9 | -155.7 | -178.3 | -204.2 | -233.9 |
| Capital Expenditure, % | -11.99 | -13.55 | -11.34 | -6.62 | -11.71 | -11.04 | -11.04 | -11.04 | -11.04 | -11.04 |
| Tax Rate, % | 4.81 | 4.81 | 4.81 | 4.81 | 4.81 | 4.81 | 4.81 | 4.81 | 4.81 | 4.81 |
| EBITAT | 14.8 | 23.6 | 24.4 | -73.8 | 37.0 | 3.4 | 3.9 | 4.5 | 5.2 | 5.9 |
| Depreciation | ||||||||||
| Changes in Account Receivables | ||||||||||
| Changes in Inventories | ||||||||||
| Changes in Accounts Payable | ||||||||||
| Capital Expenditure | ||||||||||
| UFCF | -320.5 | -124.7 | -52.6 | -9.5 | -90.6 | -171.4 | -136.9 | -156.8 | -179.6 | -205.7 |
| WACC, % | 5.25 | 5.25 | 5.25 | 5.25 | 5.25 | 5.25 | 5.25 | 5.25 | 5.25 | 5.25 |
| PV UFCF | ||||||||||
| SUM PV UFCF | -726.5 | |||||||||
| Long Term Growth Rate, % | 4.00 | |||||||||
| Free cash flow (T + 1) | -214 | |||||||||
| Terminal Value | -17,088 | |||||||||
| Present Terminal Value | -13,229 | |||||||||
| Enterprise Value | -13,956 | |||||||||
| Net Debt | -246 | |||||||||
| Equity Value | -13,710 | |||||||||
| Diluted Shares Outstanding, MM | 452 | |||||||||
| Equity Value Per Share | -30.32 |
What You Will Receive
- Adjustable Forecast Inputs: Easily modify key assumptions (growth %, profit margins, WACC) to generate various scenarios.
- Industry Data Included: Pre-filled financial data for Henan Shijia Photons Technology Co., Ltd. (688313SS) to streamline your analysis.
- Automated DCF Results: The template calculates Net Present Value (NPV) and intrinsic value automatically for your convenience.
- Customizable and Professional Design: A refined Excel model that can be tailored to meet your valuation requirements.
- Designed for Analysts and Investors: Perfect for evaluating projections, assessing strategies, and enhancing efficiency.
Key Features
- Comprehensive DCF Calculator: Offers detailed unlevered and levered DCF valuation models tailored for Henan Shijia Photons Technology Co., Ltd. (688313SS).
- WACC Calculator: Includes a fully equipped Weighted Average Cost of Capital sheet with flexible inputs specific to your needs.
- Modifiable Forecast Assumptions: Adjust growth rates, capital expenditures, and discount rates to fit your projections.
- Integrated Financial Ratios: Evaluate profitability, leverage, and efficiency ratios relevant to Henan Shijia Photons Technology Co., Ltd. (688313SS).
- Interactive Dashboard and Visualizations: Provides graphical outputs that summarize essential valuation metrics for straightforward analysis.
How It Operates
- Download the Template: Gain immediate access to the Excel-based HST DCF Calculator for Henan Shijia Photons Technology Co., Ltd. (688313SS).
- Input Your Assumptions: Modify the yellow-highlighted cells to set growth rates, WACC, profit margins, and other key inputs.
- Instant Calculations: The model automatically recalibrates to reflect the intrinsic value of Henan Shijia Photons Technology Co., Ltd. (688313SS).
- Test Scenarios: Experiment with varying assumptions to see how they impact potential valuation.
- Analyze and Decide: Utilize the outcomes to inform your investment strategy or financial assessment.
Why Choose This Calculator for Henan Shijia Photons Technology Co., Ltd. (688313SS)?
- Reliable Metrics: Utilize actual financial data from Henan Shijia for trustworthy valuation outcomes.
- Fully Customizable: Tailor critical variables such as growth rates, WACC, and tax rates to fit your financial assumptions.
- Efficient: Pre-configured calculations save you the hassle of building from the ground up.
- Professional-Quality Tool: Crafted specifically for investors, analysts, and consultants in the tech sector.
- Easy to Use: Designed with an intuitive interface and clear instructions to accommodate users at all levels.
Who Should Utilize Our Solutions?
- Individual Investors: Gain insights to make informed decisions regarding investments in Henan Shijia Photons Technology Co., Ltd. (688313SS).
- Financial Analysts: Enhance valuation processes with our comprehensive, ready-to-implement financial models.
- Consultants: Provide accurate and prompt valuation expertise to clients with our advanced tools.
- Business Owners: Learn about the valuation practices of tech companies like Henan Shijia to refine your own business strategies.
- Finance Students: Explore valuation methodologies through practical examples and real-time data analysis.
Contents of the Template
- Operating and Balance Sheet Data: Pre-filled historical data and forecasts for Henan Shijia Photons Technology Co., Ltd. (688313SS), including revenue, EBITDA, EBIT, and capital expenditures.
- WACC Calculation: A dedicated sheet for calculating the Weighted Average Cost of Capital (WACC), encompassing parameters such as Beta, risk-free rate, and share price.
- DCF Valuation (Unlevered and Levered): Customizable Discounted Cash Flow models that display intrinsic value along with comprehensive calculations.
- Financial Statements: Pre-loaded annual and quarterly financial statements to facilitate detailed analysis.
- Key Ratios: A compilation of profitability, leverage, and efficiency ratios specific to Henan Shijia Photons Technology Co., Ltd. (688313SS).
- Dashboard and Charts: A visual overview of valuation outputs and underlying assumptions for straightforward result analysis.
Disclaimer
All information, articles, and product details provided on this website are for general informational and educational purposes only. We do not claim any ownership over, nor do we intend to infringe upon, any trademarks, copyrights, logos, brand names, or other intellectual property mentioned or depicted on this site. Such intellectual property remains the property of its respective owners, and any references here are made solely for identification or informational purposes, without implying any affiliation, endorsement, or partnership.
We make no representations or warranties, express or implied, regarding the accuracy, completeness, or suitability of any content or products presented. Nothing on this website should be construed as legal, tax, investment, financial, medical, or other professional advice. In addition, no part of this site—including articles or product references—constitutes a solicitation, recommendation, endorsement, advertisement, or offer to buy or sell any securities, franchises, or other financial instruments, particularly in jurisdictions where such activity would be unlawful.
All content is of a general nature and may not address the specific circumstances of any individual or entity. It is not a substitute for professional advice or services. Any actions you take based on the information provided here are strictly at your own risk. You accept full responsibility for any decisions or outcomes arising from your use of this website and agree to release us from any liability in connection with your use of, or reliance upon, the content or products found herein.