
|
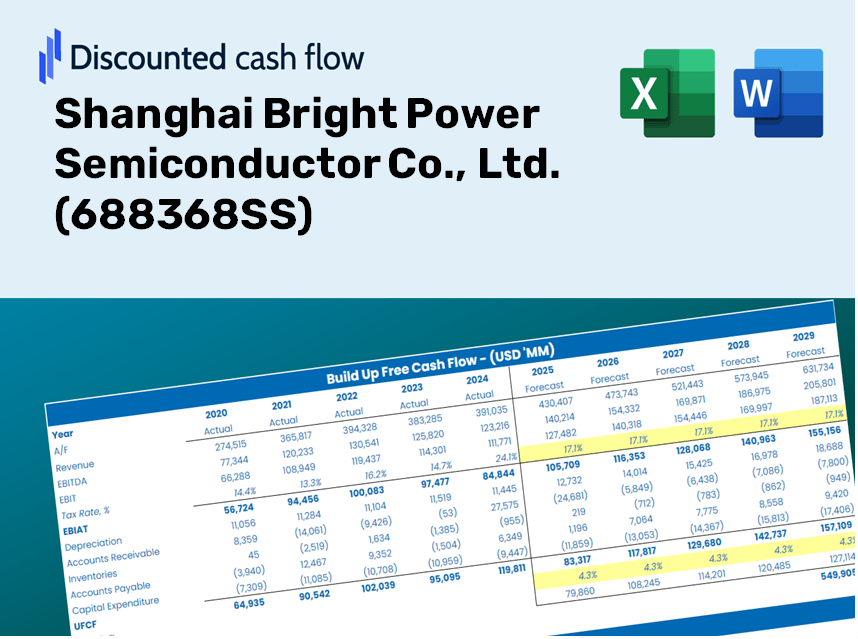
Shanghai Bright Power Semiconductor Co., Ltd. (688368.SS) DCF Valuation |
Fully Editable: Tailor To Your Needs In Excel Or Sheets
Professional Design: Trusted, Industry-Standard Templates
Investor-Approved Valuation Models
MAC/PC Compatible, Fully Unlocked
No Expertise Is Needed; Easy To Follow
Shanghai Bright Power Semiconductor Co., Ltd. (688368.SS) Bundle
Simplify Shanghai Bright Power Semiconductor Co., Ltd. (688368SS) valuation with this customizable DCF Calculator! Featuring real Shanghai Bright Power Semiconductor Co., Ltd. (688368SS) financials and adjustable forecast inputs, you can test scenarios and uncover Shanghai Bright Power Semiconductor Co., Ltd. (688368SS) fair value in minutes.
Discounted Cash Flow (DCF) - (USD MM)
| Year | AY1 2020 |
AY2 2021 |
AY3 2022 |
AY4 2023 |
AY5 2024 |
FY1 2025 |
FY2 2026 |
FY3 2027 |
FY4 2028 |
FY5 2029 |
|---|---|---|---|---|---|---|---|---|---|---|
| Revenue | 1,102.9 | 2,302.3 | 1,079.4 | 1,303.2 | 1,503.6 | 1,815.6 | 2,192.3 | 2,647.2 | 3,196.5 | 3,859.7 |
| Revenue Growth, % | 0 | 108.75 | -53.12 | 20.74 | 15.38 | 20.75 | 20.75 | 20.75 | 20.75 | 20.75 |
| EBITDA | 31.4 | 664.0 | -260.0 | -48.7 | 41.4 | 24.0 | 29.0 | 35.0 | 42.3 | 51.0 |
| EBITDA, % | 2.85 | 28.84 | -24.09 | -3.74 | 2.75 | 1.32 | 1.32 | 1.32 | 1.32 | 1.32 |
| Depreciation | 11.3 | 18.6 | 28.1 | 44.0 | 44.0 | 39.0 | 47.1 | 56.8 | 68.6 | 82.9 |
| Depreciation, % | 1.02 | 0.80576 | 2.6 | 3.37 | 2.93 | 2.15 | 2.15 | 2.15 | 2.15 | 2.15 |
| EBIT | 20.2 | 645.5 | -288.1 | -92.7 | -2.7 | -15.0 | -18.1 | -21.8 | -26.4 | -31.8 |
| EBIT, % | 1.83 | 28.04 | -26.69 | -7.11 | -0.17809 | -0.82477 | -0.82477 | -0.82477 | -0.82477 | -0.82477 |
| Total Cash | 522.3 | 914.2 | 441.1 | 308.0 | 281.0 | 618.2 | 746.5 | 901.4 | 1,088.4 | 1,314.2 |
| Total Cash, percent | .0 | .0 | .0 | .0 | .0 | .0 | .0 | .0 | .0 | .0 |
| Account Receivables | 417.3 | 414.3 | 323.9 | 385.2 | 406.9 | 517.3 | 624.6 | 754.2 | 910.7 | 1,099.6 |
| Account Receivables, % | 37.83 | 18 | 30 | 29.56 | 27.06 | 28.49 | 28.49 | 28.49 | 28.49 | 28.49 |
| Inventories | 152.1 | 390.8 | 253.3 | 246.6 | 232.8 | 321.9 | 388.7 | 469.3 | 566.7 | 684.3 |
| Inventories, % | 13.79 | 16.98 | 23.47 | 18.93 | 15.48 | 17.73 | 17.73 | 17.73 | 17.73 | 17.73 |
| Accounts Payable | 268.2 | 230.8 | 140.6 | 170.4 | 235.1 | 276.3 | 333.6 | 402.8 | 486.4 | 587.3 |
| Accounts Payable, % | 24.32 | 10.02 | 13.03 | 13.08 | 15.64 | 15.22 | 15.22 | 15.22 | 15.22 | 15.22 |
| Capital Expenditure | -33.5 | -58.1 | -190.1 | -23.6 | -16.6 | -94.8 | -114.4 | -138.2 | -166.8 | -201.4 |
| Capital Expenditure, % | -3.04 | -2.52 | -17.61 | -1.81 | -1.11 | -5.22 | -5.22 | -5.22 | -5.22 | -5.22 |
| Tax Rate, % | -525.83 | -525.83 | -525.83 | -525.83 | -525.83 | -525.83 | -525.83 | -525.83 | -525.83 | -525.83 |
| EBITAT | 19.7 | 575.3 | -333.6 | -115.0 | -16.8 | -14.6 | -17.6 | -21.3 | -25.7 | -31.0 |
| Depreciation | ||||||||||
| Changes in Account Receivables | ||||||||||
| Changes in Inventories | ||||||||||
| Changes in Accounts Payable | ||||||||||
| Capital Expenditure | ||||||||||
| UFCF | -303.8 | 262.6 | -357.7 | -119.5 | 67.4 | -228.6 | -201.7 | -243.6 | -294.1 | -355.2 |
| WACC, % | 6.98 | 6.96 | 6.98 | 6.98 | 6.98 | 6.98 | 6.98 | 6.98 | 6.98 | 6.98 |
| PV UFCF | ||||||||||
| SUM PV UFCF | -1,067.1 | |||||||||
| Long Term Growth Rate, % | 2.00 | |||||||||
| Free cash flow (T + 1) | -362 | |||||||||
| Terminal Value | -7,279 | |||||||||
| Present Terminal Value | -5,195 | |||||||||
| Enterprise Value | -6,262 | |||||||||
| Net Debt | 67 | |||||||||
| Equity Value | -6,330 | |||||||||
| Diluted Shares Outstanding, MM | 87 | |||||||||
| Equity Value Per Share | -72.77 |
What You Will Receive
- Genuine 688368SS Financial Data: Access to both historical and projected information for precise valuation.
- Customizable Inputs: Adjust parameters such as WACC, tax rates, revenue growth, and capital expenditures.
- Automated Calculations: Dynamic computation of intrinsic value and NPV.
- Scenario Analysis: Evaluate various scenarios to assess Shanghai Bright Power Semiconductor's future outlook.
- Sleek and User-Friendly Design: Designed for professionals while remaining easy to navigate for newcomers.
Key Features
- Accurate Financial Data: Gain access to reliable pre-loaded historical figures and forecasts tailored for Shanghai Bright Power Semiconductor Co., Ltd. (688368SS).
- Tailored Forecast Parameters: Modify highlighted cells for key assumptions like WACC, growth rates, and profit margins.
- Automated Financial Calculations: Experience real-time updates on DCF, Net Present Value (NPV), and cash flow analyses.
- Interactive Visualization Dashboard: Utilize clear charts and summaries to interpret your valuation findings effortlessly.
- Designed for All Users: An intuitive layout suitable for investors, CFOs, and consultants, whether you're a novice or an expert.
How It Works
- Step 1: Download the prebuilt Excel template featuring Shanghai Bright Power Semiconductor Co., Ltd.'s (688368SS) data.
- Step 2: Review the pre-filled sheets to familiarize yourself with the essential metrics.
- Step 3: Adjust forecasts and assumptions in the editable yellow cells (WACC, growth, margins).
- Step 4: Instantly see the recalculated results, including the intrinsic value of Shanghai Bright Power Semiconductor Co., Ltd. (688368SS).
- Step 5: Utilize the outputs to make informed investment decisions or create detailed reports.
Why Choose Shanghai Bright Power Semiconductor Co., Ltd. (688368SS)?
- Precision: Leverages reliable financial data to ensure accuracy.
- Adaptability: Built for users to easily experiment and adjust parameters.
- Efficiency: Eliminate the need to create a financial model from the ground up.
- Expert-Level: Crafted with the expertise and functionality expected at the CFO level.
- Intuitive: Simple to navigate, even for those without extensive financial modeling skills.
Who Can Benefit from Shanghai Bright Power Semiconductor Co., Ltd. (688368SS)?
- Investors: Gain insights and make informed decisions with our advanced semiconductor innovation.
- Financial Analysts: Streamline your analysis with data-rich resources tailored for semiconductor market trends.
- Consultants: Effortlessly modify our solutions for impactful presentations or strategic reports to clients.
- Tech Enthusiasts: Enhance your knowledge of semiconductor technologies through practical applications and case studies.
- Educators and Students: Leverage our offerings as a hands-on educational resource in technology and finance curricula.
Contents of the Template
- Pre-Filled DCF Model: Shanghai Bright Power Semiconductor Co., Ltd.'s (688368SS) financial data preloaded for immediate analysis.
- WACC Calculator: Comprehensive calculations for Weighted Average Cost of Capital.
- Financial Ratios: Assess Shanghai Bright Power’s profitability, leverage, and operational efficiency.
- Editable Inputs: Modify assumptions like growth rates, margins, and capital expenditures to suit your forecasts.
- Financial Statements: Access annual and quarterly reports for in-depth analysis.
- Interactive Dashboard: Effortlessly visualize key valuation metrics and outcomes.
Disclaimer
All information, articles, and product details provided on this website are for general informational and educational purposes only. We do not claim any ownership over, nor do we intend to infringe upon, any trademarks, copyrights, logos, brand names, or other intellectual property mentioned or depicted on this site. Such intellectual property remains the property of its respective owners, and any references here are made solely for identification or informational purposes, without implying any affiliation, endorsement, or partnership.
We make no representations or warranties, express or implied, regarding the accuracy, completeness, or suitability of any content or products presented. Nothing on this website should be construed as legal, tax, investment, financial, medical, or other professional advice. In addition, no part of this site—including articles or product references—constitutes a solicitation, recommendation, endorsement, advertisement, or offer to buy or sell any securities, franchises, or other financial instruments, particularly in jurisdictions where such activity would be unlawful.
All content is of a general nature and may not address the specific circumstances of any individual or entity. It is not a substitute for professional advice or services. Any actions you take based on the information provided here are strictly at your own risk. You accept full responsibility for any decisions or outcomes arising from your use of this website and agree to release us from any liability in connection with your use of, or reliance upon, the content or products found herein.